In this use case we compare the target group of two distinctive products of the same company by using Mosaic Belgium. You can for example think about two car models or two series of bathroom furniture.
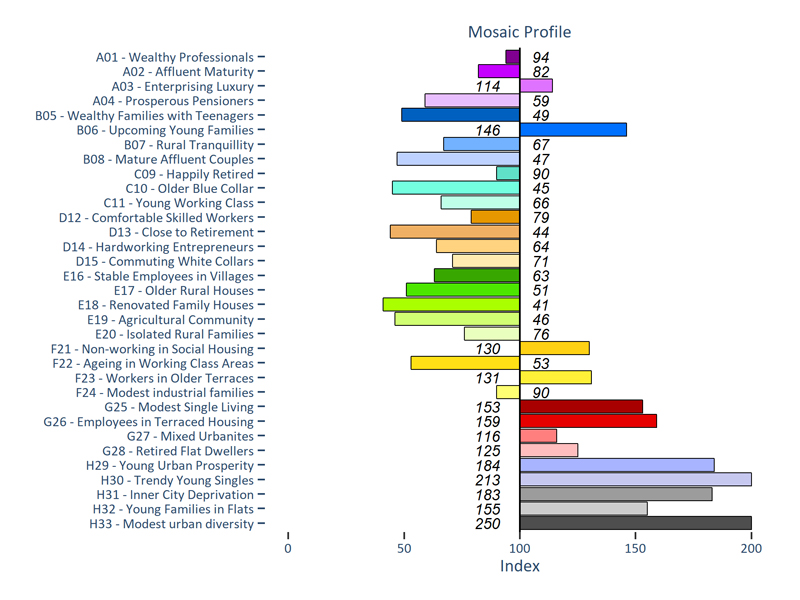
Mosaic profile 1

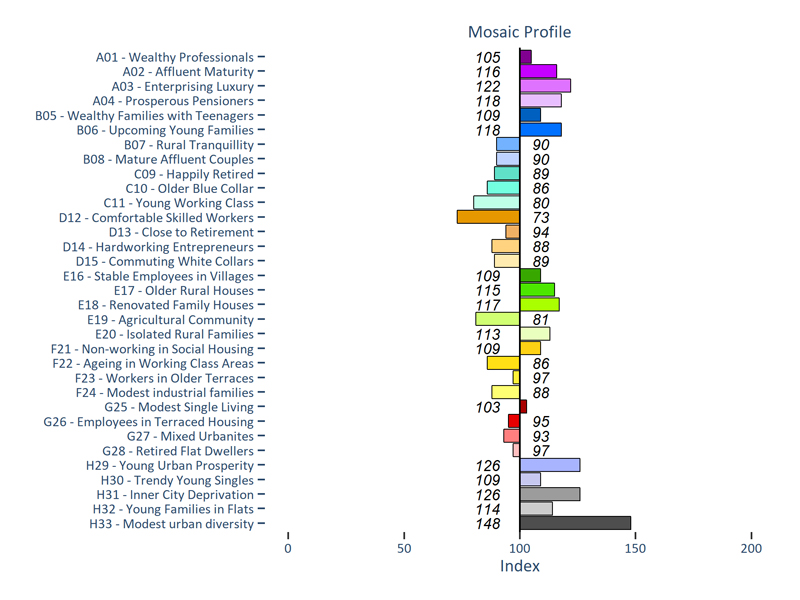
Mosaic profile 2

It is obvious that the target group of both products is quite different. Only the urban populations seem to appreciate both products. The Mosaic profile of the second product reveals prosperous households are appealed by this product while the first Mosaic profile shows that mainly urban households are appealed by the product.
By profiling the target groups you immediately understand the importance of opening points of sale near the appropriate households. Also for marketing activities it is important to organise them there where your target groups live.
Once the preference scores of each Mosaic type are calculated, they can be transposed to geographic entities through a modelling process. This way we can obtain a clear view of the market potential and attitude towards the products at different geographic levels.
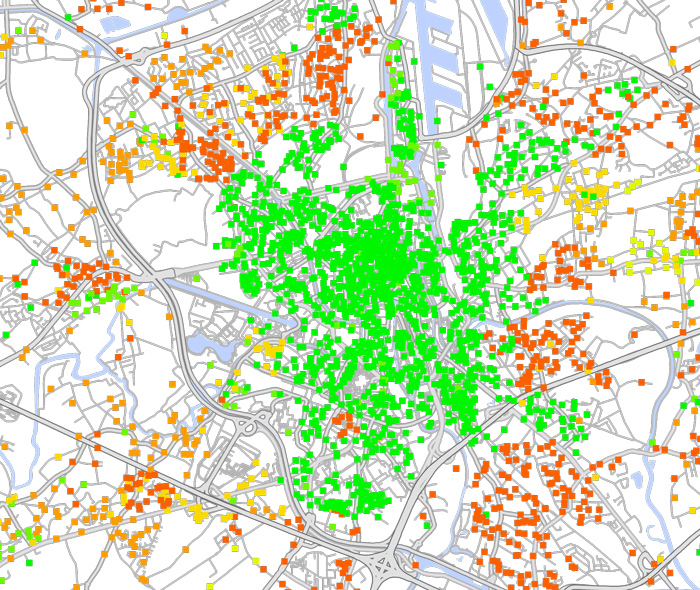
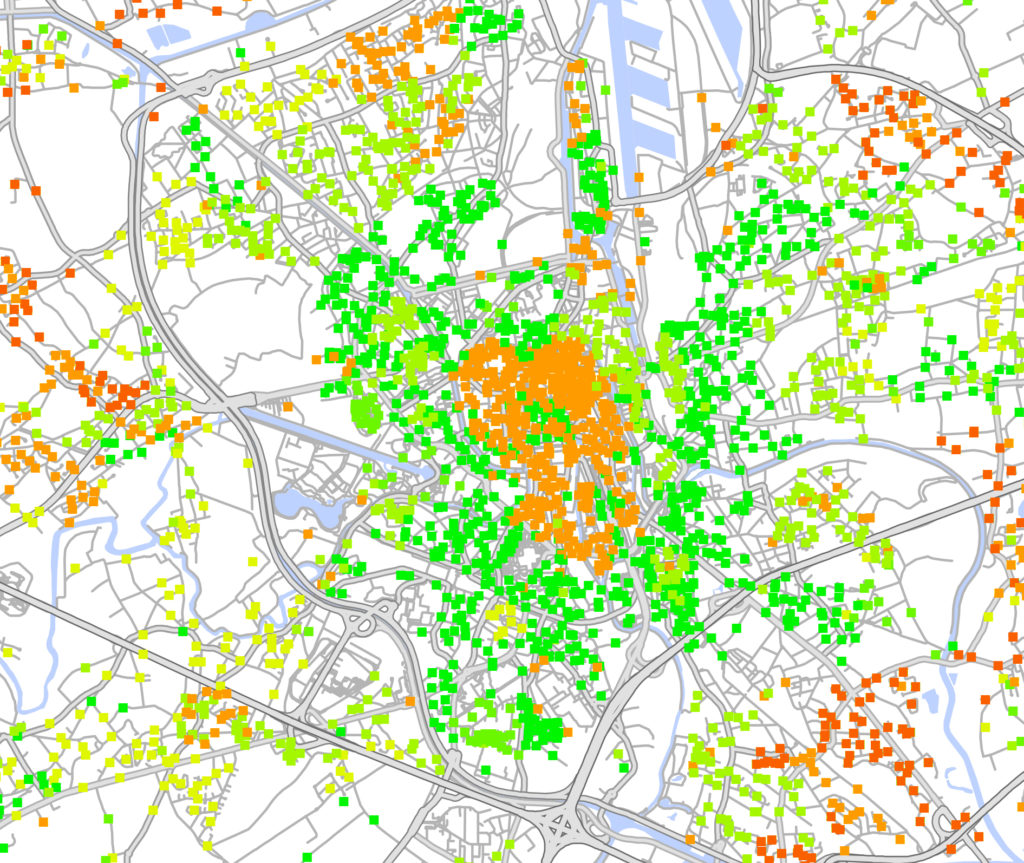
On the maps below we visualise the preference for both products for every street segment of the region. The same kind of scores can by calculated for all kind of products and services as long as sufficient data is available.
Geographic impact Mosaic profile 1

Geographic impact Mosaic profile 2

Would you like a personalised offer or a charge free test on an extract of your customer data? Contact us now for more information.