When looking for data to personalise their offer and communication according to their customers’ needs, many companies set up loyalty card systems. This is an excellent way of harvesting detailed data, which also provides a benefit to customers in the form of points, discounts or other gifts. Analysis of this data and usage in analytical models makes it possible to improve your customer knowledge and is a real gold mine when it comes to segmenting and targeting your customers, and even predicting their next purchases.
In this article you will learn about the different analyses that you can perform based on your loyalty cards, and pick up some valuable tips for improving the quality of those analyses.

Loyalty cards reveal a great deal about your customers’ buying habits. A few simple analyses enable you to produce some interesting global indicators: the proportion of your loyalty card customers and transactions in relation to the total number of transactions, the frequency of visit, the average basket, the times of purchase, the variations in terms of days and times of the week, etc.
Customers do not all share the same behaviour. For this reason, the next step involves trying to identify groups with similar behaviours within your customer base: regular customers with small average baskets, or customers who spread out their purchases but have larger average baskets. Try to find out what characterises these different groups, and use these characteristics to adapt and target your promotions and marketing campaigns.
Other information can be obtained from till receipts. Link characteristics to your customers based on the products that they purchase: products for young children, products typically linked to a specific gender or age group, products that target important factors for households (organic, fair trade, white goods purchases, etc.).
These exploratory analyses make it possible to gain a better understanding of your customers and thus adapt the organisation of your store, adjust your offer and personalise your marketing campaigns.

Loyalty cards are generally based on the customer’s postal address. If the encoding is rigorously done, or if you have a system that uses identity cards as loyalty cards, you will have data that enables you to perform the initial analyses of your local market.
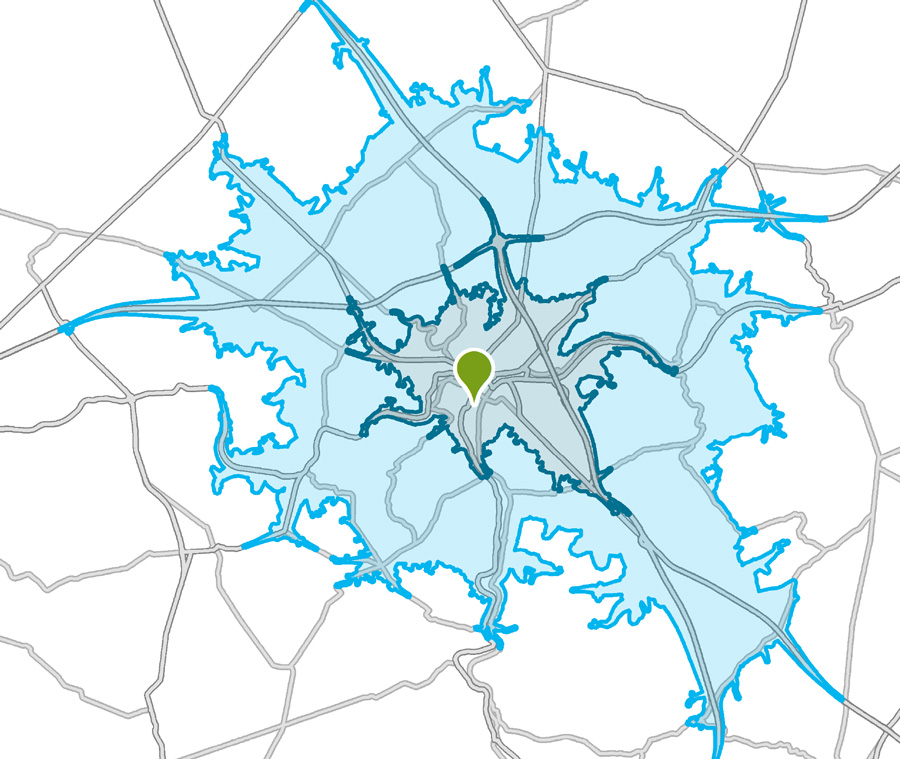
Based on your customers’ addresses, you will be able to determine and view the catchment areas for each store. This area represents the geographical origin of the majority of your customers. Often, two isochronic areas are outlined, representing the origin of 50% and 80% of the customer base. This enables you to learn about the size of your catchment areas, your customers’ average drivetime, the penetration rate (comparison of your customer base with the total population of the area) and any coverage gaps in the local area where customers are normally recruited.
Set up a system that traces the history of all your customers, their visit times and amounts they spend. Target customers who are truly profitable for your store, and determine the right time to contact them again if they stop visiting your store. Knowing about their profiles and buying habits will enable you to adjust the message to their precise context. The proposed option is a simple RFM analysis (Recency, Frequency, Monetary Value), which can rapidly bear fruit in terms of increased customer loyalty and turnover.

You have profiled your customers based on the loyalty card data. You have then determined your catchment areas. Combining these two elements will now enable you to target households within your area of influence and thus increase the return on investment from your campaigns.
Different complementary analyses will enable you to fine-tune your marketing approach and point towards practical steps: segmenting your customers into homogeneous groups and adapting your campaigns and communications to the characteristics of these groups, offering the products that are most likely to please them, identifying prospects who are most like your (best) customers, etc.
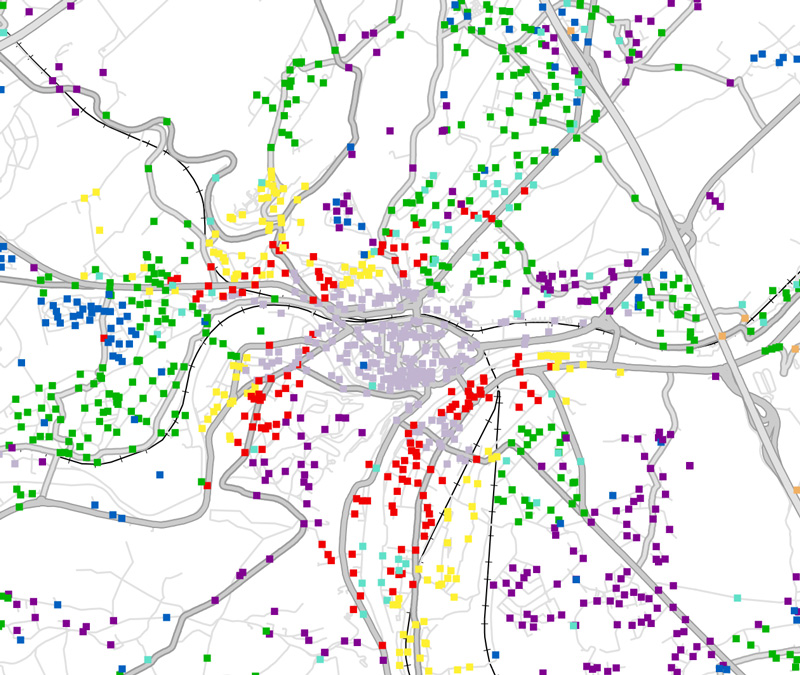
These different approaches are more reliable and interesting when you combine them with external data, such as the consumer segmentation Mosaic Belgium . This data enables you to enrich your customer data, but also serves as a reliable baseline.
For example, you can compare your customer base with the total population of a particular geographical area in order to determine the most strongly represented types of consumers within your customer base. Examining the characteristics of these most represented types gives you an accurate picture of your customers and what distinguishes them from the rest of the population.
In order to identify areas for expansion, it is vital to know the origin and characteristics of the customer base. The analyses described above allow you to gain a better understanding of the behaviour, motivations and drivetimes of your customers.
Experience tells us that this journey time is closely linked to the sector of activity and is often proportional to the monetary value of the purchase. However, even within a retail chain, differences can be observed according to the level of urbanity.
Superimposing the catchment areas of all your points of sale allows you to identify areas with weaker coverage. But beware of jumping to hasty conclusions. Before rushing to open a new point of sale, it is wise to check whether the households that are living in that area are similar to your target group, whether there is a sufficient number of such households, and whether the market potential is sufficient to ensure the viability of a point of sale, which also means checking the competitive environment of the location concerned.
These more advanced analyses require additional data about households, spending and the presence of competitors. Before obtaining these data, we advise you to decide whether you have the expertise and tools necessary to carry out these more complex studies properly. If this is not the case, it might be more profitable and useful to contact us so that we can devise an approach according to your needs and type of business.
Retailers who have already conducted a good number of analyses based on customer data will not limit themselves to the above-mentioned exploratory analyses. They will concentrate, for example, on producing more complex analytical models that make it possible to anticipate certain events and predict the future behaviour of each customer.
Combining the data of your loyalty cards, of your marketing tools and Mosaic Belgium data with advanced models makes it possible to move on to the prediction stage: estimating the risk of future disloyalty, the moment of the next purchase, the products that the customer will purchase, the best time to contact your customer, etc.
Despite a genuine desire to personalise their marketing campaigns, many retailers face real problems when using the data from their loyalty cards. The biggest difficulty is the quality of the data collection. Either the collection is limited to postcodes or the encoding of addresses is carried out manually, which results in various encoding errors. In both cases, the customers cannot be located or only on an insufficiently fine scale for the conduct of meaningful analyses.
Problems also arise for retailers who work with franchisees. These retailers often experience difficulties in accessing customer data. However, it is essential to have comprehensive data on the entire network of points of sale in order to conduct the analyses correctly, especially if the geographical component is required.
Finally, many difficulties are linked to the organisation of the company itself. As well as a lack of tools and in-house expertise, at SIRIUS Insight we notice that companies do not know how to act on the results obtained from the analyses. We recommend that you think carefully, from the outset, about an action plan that makes it possible to unite everyone around the same objective. A well-defined marketing vision makes it possible to create a real dynamic and to use the right channels in the right places, at the right times and with the strongest messages.

The analysis, profiling and segmentation of customer data is very enriching for the development of a company. But it is still important to realise that using loyalty card customer data alone runs the risk of leading you to false conclusions.
For example, you notice that a customer is not buying any wine from your food store. You might deduce that this customer does not drink any wine, when in fact he is a true wine lover who buys from specialist stores. How could you know this? Simply by working out – through an enrichment of your data – that this customer (or customer group) belongs to a consumer type that is particularly fond of quality wines. Working this out will enable you to offer a selection of appropriate wines.
The addition of data such as that offered by Mosaic Belgium makes it possible to extend your customer knowledge and perform high added-value analyses and modelling. Our consumer segmentation will enrich your customer data with socio-demographic factors, buying habits and preferences about mobility, media, etc. Mosaic Belgium also allows you to estimate and locate a market potential, support the development of your network, identify look-a-likes, determine areas for door-to-door campaigns, open pop-up shops, etc.
Do you want to gain a better understanding of your customer base by performing analyses using your loyalty cards? We would like to offer you a few tips to help you get off on the right foot: