We were recently asked to provide more information on Belgian consumers and their purchasing habits. What does the Belgian consumer look like and what drives him? What opportunities does this offer retailers? As a geomarketing expert SIRIUS Insight has a great deal of knowledge about Belgian consumers and their specific characteristics. We crossed this data with the catchment area of the 50 largest inner-city shopping areas in Belgium to get the insights listed below.
Belgium has approximately 11 million inhabitants and 4,8 million households in 2019 (learn more about this trend in 2022). Population growth has been moderate but relatively stable (0,5% per annum) in recent years. The average size of households continues to decline (34% single-person households, families have fewer children). Other important evolutions are the ageing of the population, the increase in the number of online purchases, the changing mobility habits (stabilising car park, car sharing, mobility as a service, etc.), changing behaviour (organic, hobbies, holidays, ‘uberisation’, etc.), and the changing retail market (bankruptcies, new players, etc.). All these evolutions have a major impact on companies operating in B2C markets.
Is there really such a thing as ‘THE’ Belgian consumer? Can we describe the 11 million inhabitants by saying that they all love beer, eat chips and chocolate, and earn an average of €18.000? If you look around your workplace, the shopping street, or your neighbourhood, you will immediately see that there is no such thing as ‘THE’ Belgian consumer. This is why SIRIUS Insight built Dividuals consumer segmentation.
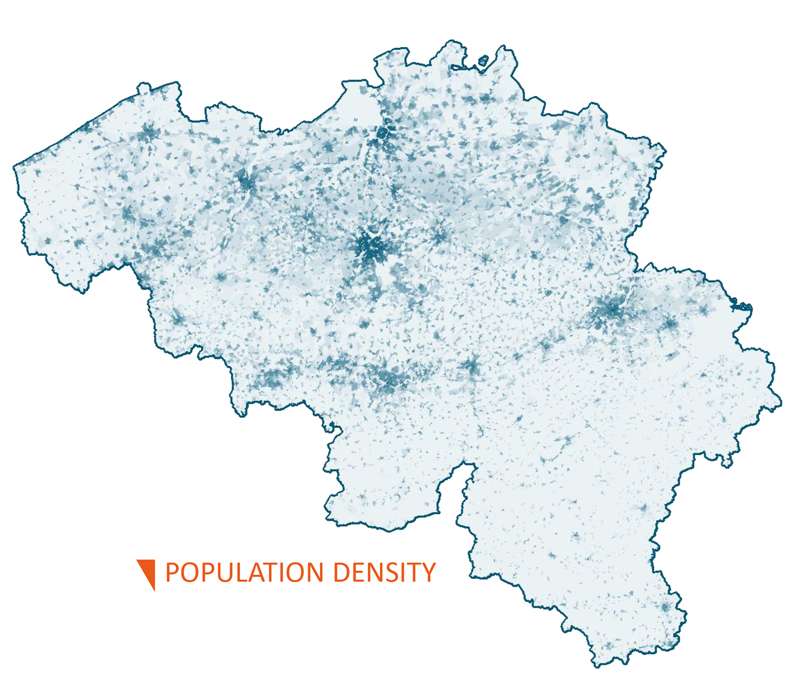
In addition, consumers in Belgium are particularly heterogeneous. The first proof of this is the distribution of the population throughout Belgium. We notice that both the spread and the concentration are very variable in this regard. The concentration of households is highest in Brussels where11% of the households live . We find 57% of the households in Flanders and 32% in Wallonia.
This heterogeneity is noticeable in many other areas. In Belgium, king car continues to dominate mobility. Only 11% of households do not own a car at all. And yet, in our analyses, we noticed that in a municipality like Sint-Joost-ten-Noode, 38% of households do not have a car, while in Bekkevoort, this is only 3% of households.
We also see significant differences in the consumption of organic products. While an average of 23% of households indicate that they buy organic products on a regular basis, the population in Houthalen Helchteren shows a very limited interest in these products (13% of households), while this interest is particularly strong (42% of households) in Lasne.
If we look at household income, we see that certain types of population have to make ends meet with an average income of €15.000 (net, per return), while well-to-do households do so with an average of €40.000 (net, per return). The purchasing power and consumption priorities of the two types of consumers are therefore also very different.
In short, the launch of your product, the opening of your point of sale, the ROI of your marketing campaign, etc. stands or falls with the correct selection and localisation of your target group.
E-commerce is fairly well established in Belgium. On average, 7 out of 10 households in Belgium make at least one purchase via the Internet each year. A high degree of penetration that nevertheless needs to be qualified. Among the types of households with the lowest propensity to online purchases (read more about Dividuals), only half of these households make online purchases. This contrasts sharply with the types of households that have the highest propensity to online purchases. Among these households, no less than three quarters of them buys online.
And yet, even the consumer types with the lowest score can be very interesting for your company! A little further on, you can read more about the Dividuals consumer segmentation, but we are already starting with a concrete example. The Dividuals sub-segment that is least inclined to make online purchases is the type “F23 Workers in Older Terraces ’. Approximately 205.000 households (4,2% of all households in Belgium) of this type can be found in Belgium. On average, only 53% of these households buy online (at least one purchase a year). And yet, our data show that they score higher than the national average for certain categories of products: music and films, food, gambling products, and they also score higher than average for the purchase of fashion products. For example, if you are offering a new streaming service, this may well be your target group.
The findings are similar for many other products. On average, 87% of Belgian households use online banking. In reality, this result is between 76% and 92%, depending on the type of consumer.

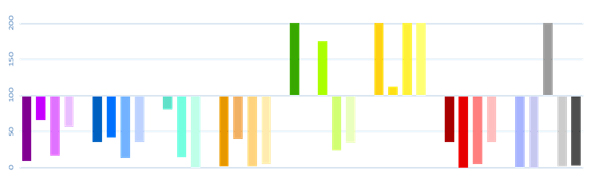
When clients ask us where to find their target group, where to open a point of sale, or how much turnover they can expect, we at SIRIUS Insight put on our Dividuals glasses. Dividuals is a geographical consumer segmentation. In concrete terms, we collect a great deal of data on Belgian households: income, family composition, mobility, age, type of housing, spending habits, etc. and classify these into 8 groups and 33 types. Because Dividuals is available for every street section, it is possible to carry out very detailed analyses.
Dividuals not only offers a new perspective on who your customers are and how they behave. By comparing your customer profile with the profile of the entire population, we also determine which consumers most closely resemble your customers and where they are located. This is a major asset for all companies operating in a B2C market.
In the analysis of the catchment areas of the largest shopping areas in Belgium, we used Dividuals to illustrate how different the population is in different areas.
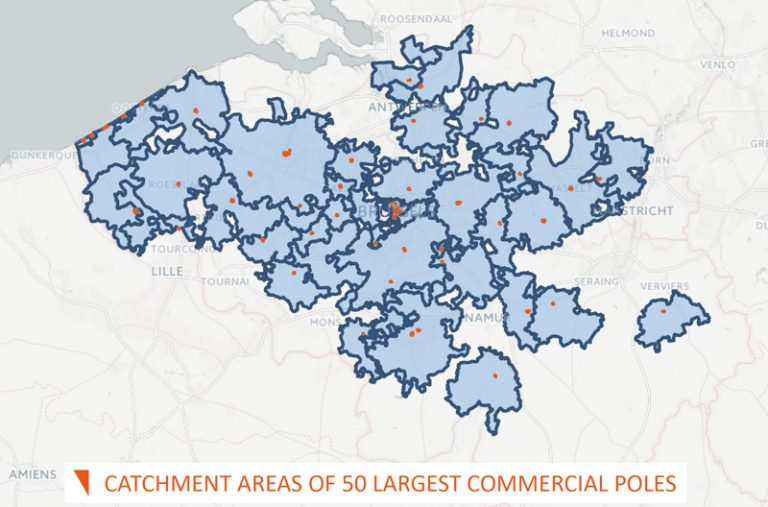
The catchment area of a point of sale (or shopping mall or shopping area) is the area from which customers come to make purchases. The map shows the catchment areas of the 50 largest inner-city shopping areas in Belgium. It is immediately noticeable that the catchment areas are not the same size. The largest catchment area (Brussels Centre shopping area) has no less than 601.000 households, while the smallest catchment area (Spa Centre shopping area) has only 12.000 households. You immediately understand why the market potential of a point of sale is not the same in both areas.
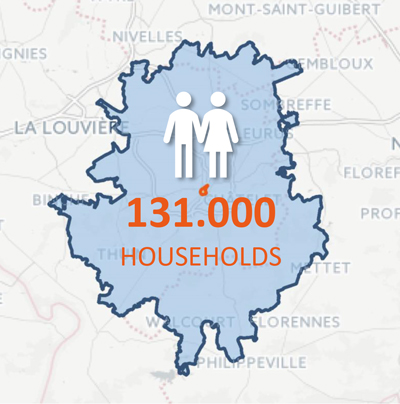
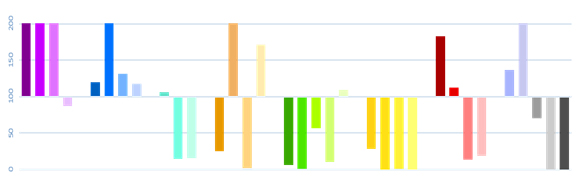
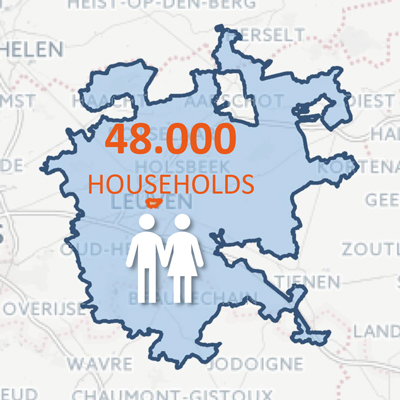
The contrast is even greater when we compare the catchment areas of two shopping areas. Take Leuven and Charleroi, for example. The Charleroi catchment area has the largest number of households (131.000 compared to 48.000), but the average income in Leuven is much higher (€28.360 compared to €21.815). If we compare the Mosaic profiles of both catchment areas, we see that they are almost a mirror image. In Charleroi, the ‘E16 Stable Employees in Villages, ‘F23 Workers in Older Terraces, and ‘F24 Modest Industrial Families are the three most common Mosaic types. In Leuven, we notice that the three most prominent Dividuals sub-segments are ‘A02 Affluent Maturity, ‘A03 Enterprising Luxury, and ‘D13 Close to Retirement.
When determining the profile of the Dividuals sub-segments present, we outline their preferences and behaviour very precisely. The strength of this is that the preferences we have are not directly linked to the brands that are present in a certain region and, therefore, are a good indicator when determining new sites.
On average, households in the Charleroi catchment area have a higher preference (than the Belgian average) for shopping by car. They appreciate chains like Kiabi, PointCarré, Intermarché, and Cora. These types do not or hardly go out to a restaurant and do not often go on holiday. Despite the fact that these types buy online less frequently than other households, we do notice that fashion items are among the purchases that they make online.
Households in the Leuven catchment area are also fervent users of the car for shopping. Their preference for chains such as River Woods, Promod, ZEB, and Delhaize is particularly strong. These households regularly visit restaurants and often go on holiday several times a year. They buy online slightly easier than average (compared to all Belgian households), but they score much lower for the online purchase of fashion items.
For retailers, the heterogeneity of the Belgian population is a complex issue. Only by locating points of sale and planning actions in large and medium-sized cities will not necessarily lead to the desired success.
The questions ‘Where can I find my target group?’, ‘Where do I open points of sale?’, ‘What turnover can I expect?’, or ‘Does my target group buy online?’ can only be answered by performing detailed analyses with sufficient consumer data.
Geomarketing studies make it possible to obtain an objective picture of the market in which one is active. Target group analyses provide insight into the (socio-demographic, financial, behavioural) characteristics of your customers and prospects. By locating them geographically and analysing their spending patterns, we provide detailed recommendations in terms of expansion strategy, performance audit, local marketing strategy, etc.