The size of households in Belgium
SIRIUS Insight is an expert in geomarketing and has been active for over 30 years on the Belgian market. We closely monitor the characteristics of Belgian households and how these change over time. Thanks to this detailed knowledge, we have the most advanced data on the Belgian market. The Belgian population is constantly changing, and this affects every merchant and non-merchant company operating in a B2C or B2B2C environment.
Through a series of articles on Belgian demographics, you will discover the changes over the last ten years and how these changes affect you. In this third article, we examine the changes in the size and types of households.
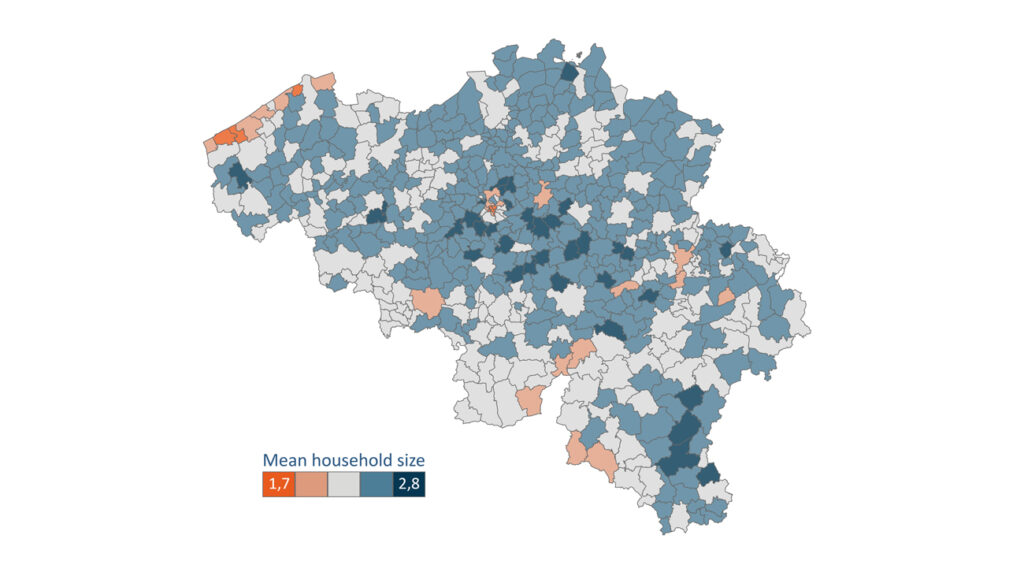
In 2021, Belgium had 11,5 million inhabitants divided into 5 million households. The average household size in Belgium is 2,3 people per household. When we look at how this average family size has evolved over the last decade, we see that the size has remained fairly stable. However, a slight trend can be discerned. In Flanders and Wallonia, the size of households is decreasing slightly, whereas in Brussels we see a slight increase.

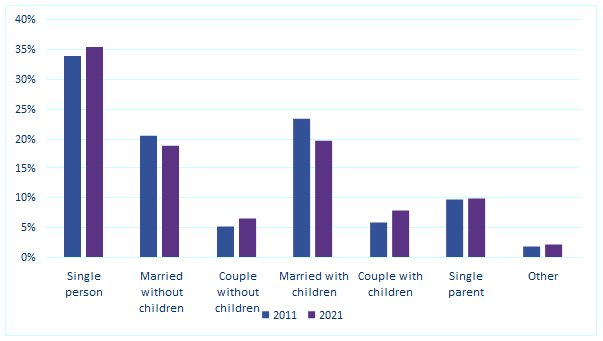
Families with or without children, married couples, single people, etc. – what type of household do we find the most in Belgium? What trends can be seen? Firstly, it is interesting to know that 65% of households are composed of at least two people, and therefore 35% of households are composed of only one person. This proportion of “single-person” households has risen over the last decade. It should be noted that the category labelled “single-person” includes all persons living alone, whether they are actually unmarried, separated or widowed.
Marital status has also evolved over the past 10 years. There are significantly more unmarried couples (with or without children) today than in 2011.

In previous articles (population volume, population age), we saw that some changes show local variations. For example, the Brussels population is growing faster, but its age remains stable over time. There are also some notable differences in terms of the different types of households represented.
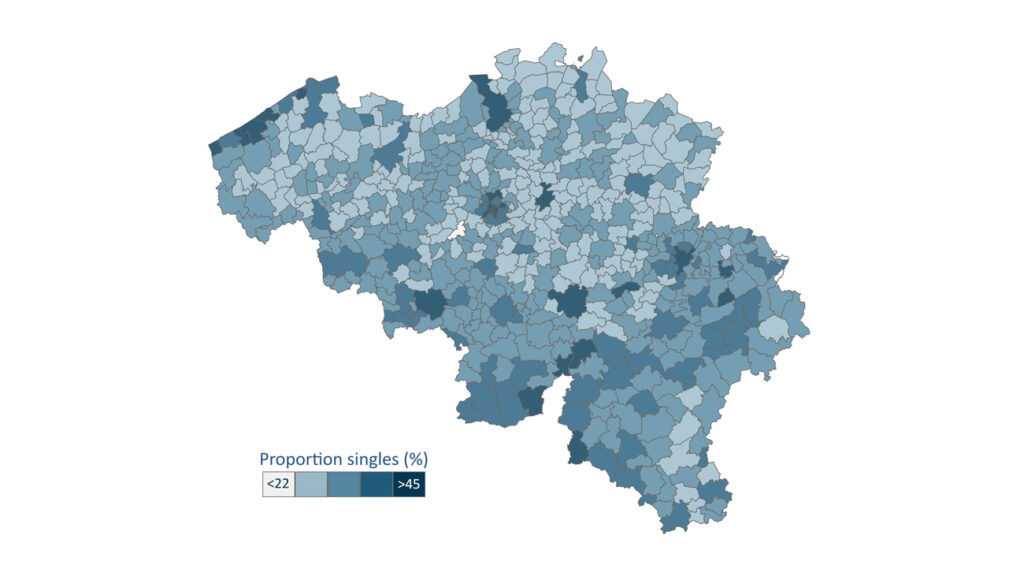
Almost one in two households is composed of only one person in Brussels.
This type of household represents 46% of all Brussels households. In Wallonia, it represents 37% of households, while the figure for Flanders is 32%. In contrast, over the last ten years, this proportion has remained stable in Brussels, while it is growing in other parts of the country.
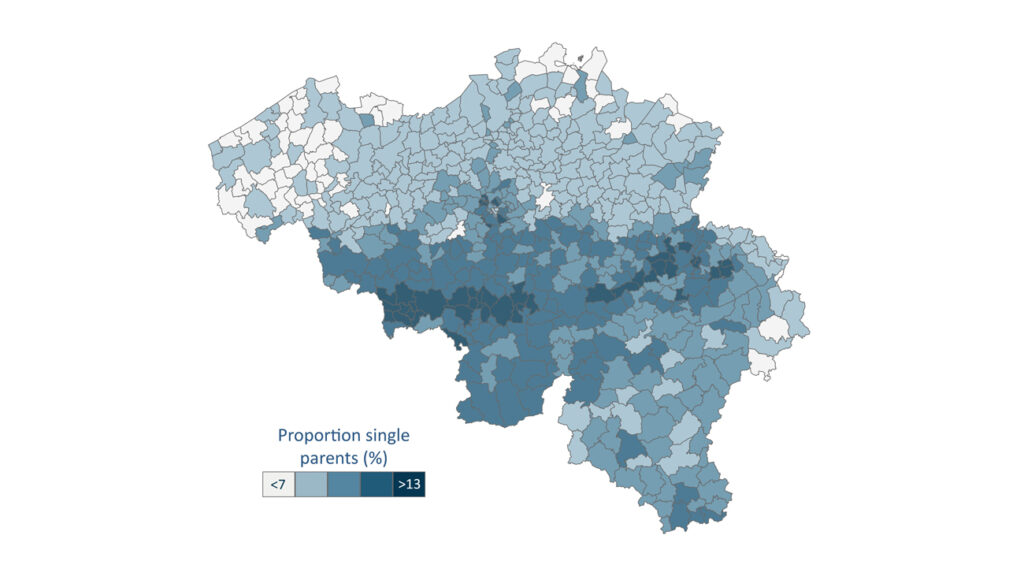
In Wallonia and Brussels (12%), the proportion of single-parent families is significantly higher than in Flanders (8%). Far more married couples with no children are found in Flanders (22%) than in Brussels (9%) and Wallonia (16%). In West Flanders, the situation is even more marked. One in four households is a married couple without children.


These changes in household types, including the growth of “single-person” households, bring about changes in needs. These households do not have the same means or the same needs, and they have different consumption habits. These needs concern housing, mobility, product packaging, types of shops and services of different kinds. For merchant and non-merchant actors like yourselves, it is essential to understand the local variations so that you can offer the appropriate services to the right target groups in the right locations.
With 30 years’ experience, SIRIUS Insight can help you to define and locate your target group. We help businesses in all sectors to develop an efficient network of points of contact that meets the needs of your target group. We have the most up-to-date and advanced data on Belgian consumers, while respecting their privacy. Contact us if you would like to obtain quality support or have access to our different types of detailed data.
Look out for more articles on the changing Belgian population and its diversity.
In the coming weeks, we will also examine the changes in household income and in housing. Don’t want to miss anything? Sign up immediately for our newsletter.