The geoconsumption model makes it possible to distribute any type of potential between the points of sale. The proximity of the point of sale, its size and its attractiveness are some of the parameters involved in this distribution.
The model also simulates the effects of opening a new point of sale. This makes it possible to estimate the turnover as well as the impact on the existing points of sale. Thus, you can measure and quantify the effects of the different scenarios and make the decisions that deliver the best results.
Are there plans to close a point of sale? In this case, the geoconsumption model quantifies the probable losses of customers and the possible transfers to nearby points of sale.

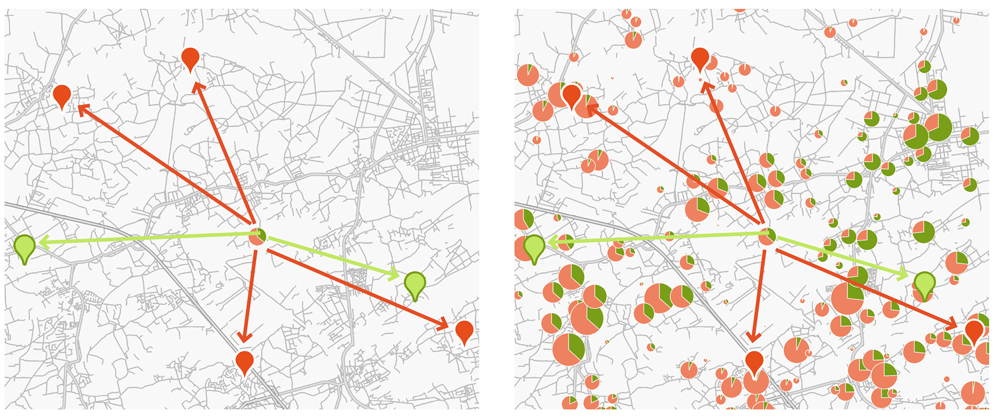
The two maps show the distribution of the market potential. The green symbols represent the analysed points of sale. The red symbols represent the competitors.
Each disc represents the market potential in a census district. The size of the disc is proportional to the value of the market potential.
The green part of the disc is the proportion of the market potential captured by the points of sale in the analysed network. In addition, the red part shows the proportion captured by the competition. This distribution of the market potential is done for all census districts.