
Changes in household income
SIRIUS Insight is an expert in geomarketing and has been active for over 30 years on the Belgian market. We closely monitor the characteristics of Belgian households and how these change over time. Thanks to this detailed knowledge, we have the most advanced data on the Belgian market. The Belgian population is constantly changing, and this affects every merchant and non-merchant company operating in a B2C or B2B2C environment.
Through a series of articles on Belgian demographics, you will discover the changes over the last ten years and how these changes affect you. In this fourth article, we examine the changes in household income.
For this fourth analysis, we looked at the changes in the income of Belgian inhabitants between 2011 and 2019 (the most recent year for which official data is available). This refers to the gross income for the full year for all inhabitants, regardless of their age. This approach helps to eliminate the effect of joint reporting by married couples or statutory cohabitants.
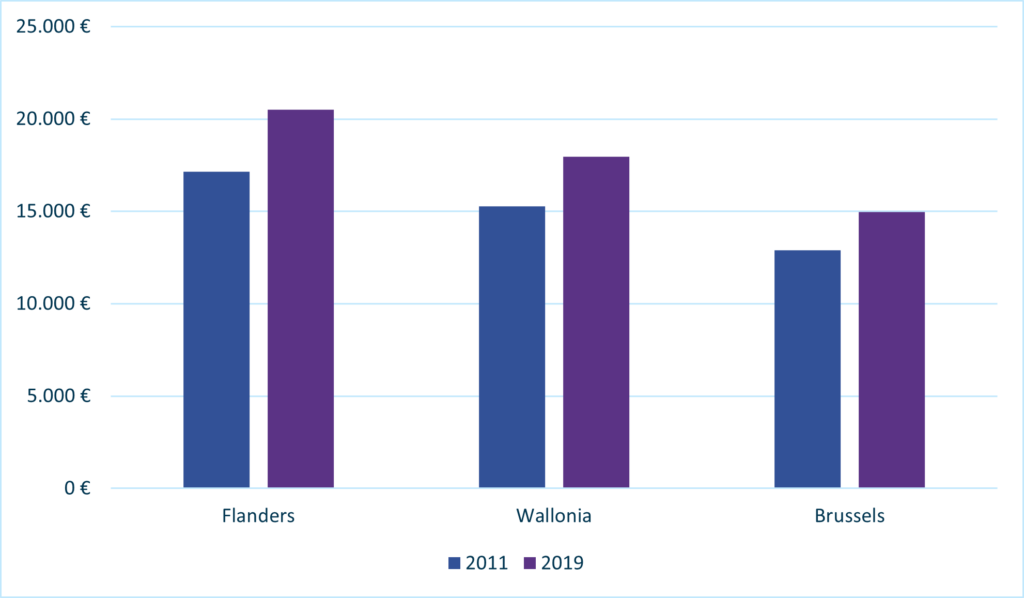
Household incomes in Belgium underwent a substantial change over the reference period. Average income increased by €3.000 from €16.100 in 2011 to €19.100 in 2019. In Flanders, the average income was the highest (€20.500 per capita) and saw the most marked increase (+€3.400 per capita). In Wallonia, the average income increased by €2.700 to reach €18.000 in 2019. The inhabitants of Brussels have the lowest average income (€15.000 per capita) and the lowest growth (+€2.000 per capita).
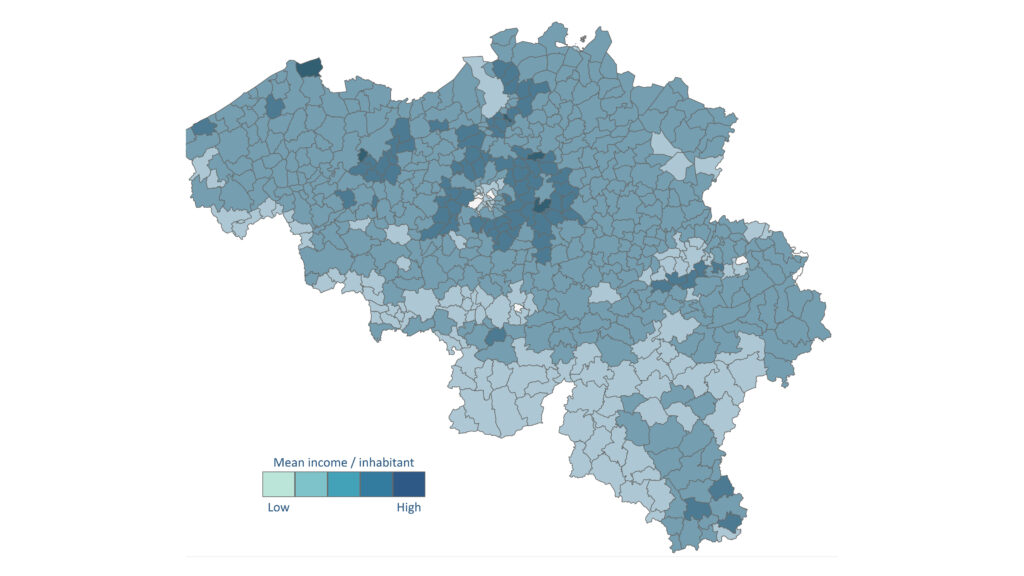
The figures presented in the preceding paragraph highlight regional disparities. When we look at inhabitants’ incomes at province level, we can nuance some of the findings. The provinces with the highest incomes (approx. €22.000 per capita) are Flemish Brabant and Walloon Brabant. The other Flemish provinces have more similar incomes (€20.000). In Wallonia, the situation is more mixed. The average income varies between €16.500 and €22.000 per capita. The highest growth is in West Flanders (+€3.500 per capita), while the lowest is in Brussels (+€2.000 per capita).
If we go down to municipality level, we can see that the most affluent municipalities are found mainly in the outskirts of Brussels. The other most affluent municipalities are located mainly in the outskirts of other major cities: Antwerp, Ghent, Leuven, Liège and Charleroi. The Belgian coast and several municipalities close to the Luxembourg border also have households with higher incomes. The lowest incomes are mainly found in the Sambre-Meuse valley, and also more markedly in the south of the country.
Purchasing power in Belgium varies greatly. Even the way in which this purchasing power changes shows substantial disparities. Disposable income, population age and socio-economic status affect consumption habits. These differences and their evolution change the needs of households. These needs concern, for example, the purchase of basic necessities, mobility, clothing, and different types of shops and services. For merchant and non-merchant actors like yourselves, it is essential to understand the local variations so that you can offer the appropriate services to the right target groups in the right locations. Acquiring data such as that offered by SIRIUS Insight will enable you to cope with all of these nuances and adjust your development according to local needs.
With 30 years’ experience, SIRIUS Insight can help you to define and locate your target group. We help businesses in all sectors to develop an efficient network of points of contact that meets the needs of your target group. We have the most up-to-date and advanced data on Belgian consumers, while respecting their privacy. Contact us if you would like to obtain quality support or have access to our different types of detailed data.
Look out for more articles on the changing Belgian population and its diversity.
In the coming weeks, we will also examine the changes in household income and in housing. Don’t want to miss anything? Sign up immediately for our newsletter.