
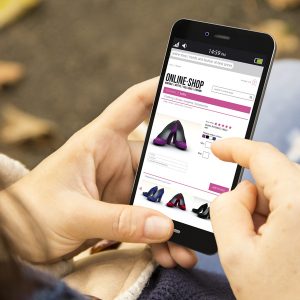
Buying online has become commonplace for most households. Around 90% of consumers between the ages of 18 and 65 made at least one online purchase in 2020. Store closures did not generate significant growth in the number of buyers, but they did lead to an increase in the buying frequency, mainly for specific types of products. In this new analysis from SIRIUS Insight, find out about the trends in Internet buying.
SIRIUS Insight collects data from a huge sample of consumers every year. This data, directly connected to the Mosaic Belgium segmentation, covers habits of buying, consumption, mobility, media, finance, lifestyle and more. SIRIUS Insight thus has a consumer segmentation enriched with many factors that allow you to know your target group better and target it more effectively.
The data collection for 2020, has nuances linked to the lockdowns. In this article, we focus in particular on lasting behaviours and highlight some notable facts relating to changes in buying habits.
E-commerce sites grew strongly in 2020. However, the year had its big winners and its losers. Overall, there was little change in the penetration rate of online purchasing. Only 7% of consumers (aged 18-65) say they never make any online purchases. Although the penetration rate did not change, we see both increases and decreases in buying frequency. These changes are linked to the types of products.
On the losing side, unsurprisingly, we see a significant drop in popularity for travel, transport or culture-related purchases (museums, cinemas, etc.). The restrictions are also leading indirectly to a reduction in purchases of cosmetic products.
The items seeing the biggest increases are fashion products and “essentials”. Thus, we find that households have become more inclined to shop online for food and pharmaceutical/parapharmaceutical products.
Finally, the figures seem to indicate that households are postponing certain purchases. For example, the number of households buying furniture products has fallen, as has the buying frequency for those products. For domestic appliances, books and magazines, we see a decrease in the number of buyers.
For several years, SIRIUS Insight has been collecting online buying information for some twenty product categories. These categories cover goods related to comfort (fashion, home furnishings, leisure), services (energy, telecommunications) and other consumer products (food, parapharmaceuticals, games, animals, etc.).
The most strongly represented product categories are fashion items, travel and leisure. More than 40% of consumers make this type of purchase each year. The buying motivations and the buying frequency vary according to the type of product, but also according to the profile of the consumer.
Nearly 60% of households buy clothing or footwear online at least once a year. In second place we find travel bookings, which were made by more than 50% of households before the pandemic. Next in line are tickets for leisure events (cinema, etc.), books, and magazines and cosmetics.
(products purchased in the last 12 months)
(products purchased in the last 12 months)
Overall, the three most important reasons for buying online are lower prices, the absence of any travel difficulties, and a wide choice. Later in the analysis you will see that the motivations and frequencies differ depending on the product and the consumer.
When we compare the motivations for buying fashion and food items online, there are some important differences:


The percentages are not cumulative, since motivation is based on multiple factors.
“Intangible” products such as financial products, museum/cinema tickets, etc. are purchased online for quite different reasons than “tangible” products.
Later in this report you will discover disparities between types of consumers. A clear link can be identified between purchasing power and motivations for online buying. Some types are particularly price-sensitive, while others simply want to avoid inconveniences.
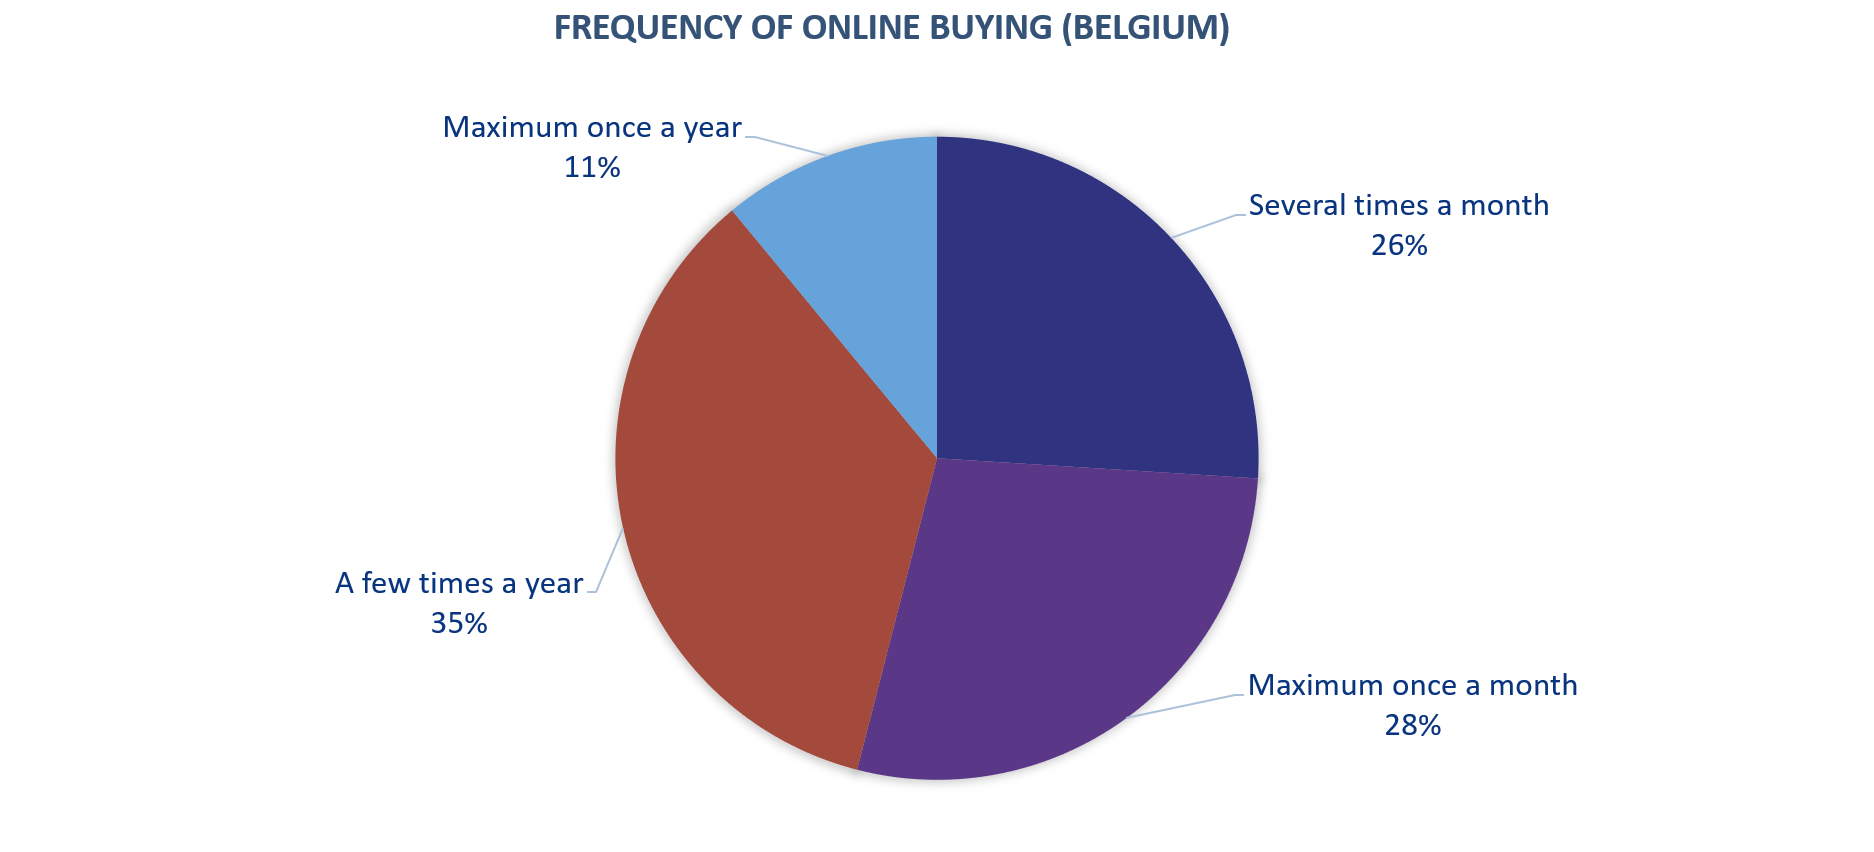
Among the households that buy online, 26% buy several times a month, 28% buy no more than once a month, 35% buy a few times each year, and finally 11% buy online no more than once a year or not at all.
If we summarise this information, 54% are regular buyers and 39% are casual buyers. For a webshop, it is essential to be able to intelligently target the customers who have the most potential. The integration of Mosaic Belgium segmentation data is a great added value for this type of classification.
The buying frequency depends, logically enough, on the product purchased. The buying frequency for fashion items (25% of regular buyers) is significantly higher than the buying frequency for mobility solutions (9% of regular buyers) or books and magazines (10% of regular buyers).
The buying frequency for food increased sharply between 2019 and 2020. The number of regular buyers increased from 6% to 12% in 2020.
The buying of fashion items remains more common among women. 66% of women buy this type of item at least once a year, compared with 49% of men. Cosmetics and health products show a similar trend: while 38% of women said they bought this type of product in 2020, only 18% of men buy these products online. There are similar findings for other products such as food, interior decor, etc.
For example, financial products tend to attract male buyers. While only 9% of women buy financial products online, men are twice as likely to do so. Similarly, men are more strongly represented for online betting, car parts and electronics.
The buying frequency is slightly higher among women. 28% of women buy online several times a month, compared with 24% of men. With regard to motivations, we find some nuances between the sexes. These motivations are made fully clear when we associate them with the products most bought by men and by women. Thus, men appear to be more sensitive to price, ease of comparison between products, and product availability. Women, meanwhile, are more sensitive to the convenience of online buying (avoidance of parking worries) and free delivery.
Buying behaviour also differs according to the age of the consumer. The percentage of e-buyers is highest in the 25-34 age group. The higher the age category, the greater the number of consumers who do not buy online. Only 3% of those in the 25-34 age group say they never buy online, compared with 10% of those aged 55-64. This percentage increases with the age of the consumer.
The type of purchase also differs according to the age of the consumer. For example, the 18-24 age group is where we find the largest number of buyers of mobility-related solutions. Those in the 35-44 group stand out strongly for the buying of toys. The “travel” category is well represented regardless of the age category. Over-the-counter medicines are in the top three of the products most bought by people in the 55-64 age group.
With regard to motivations, the main reason for buying online remains the lower price. The wide choice of products is more important than the price only for consumers under the age of 35. Consumers with families and those with an active lifestyle place particular importance on the ease of online buying and therefore on the absence of any convenience concerns.
In Belgium, there are often nuances in behaviour according to region. For e-commerce, several points can be noted. We find, for example, that the penetration rate for e-commerce is at its lowest in Wallonia. The types of products purchased and the buying motivations also differ according to region.
There are significantly more buyers of mobility-related solutions in Brussels. 37% of consumers there buy this type of service online, compared with 23% in Wallonia and 22% in Flanders. The Brussels region is also in pole position for travel and cosmetics.
Walloon households are significantly more sensitive to lower prices, convenience concerns and free delivery. Flemish households particularly appreciate the wider range available online. Brussels households attach particular importance to the permanent availability of items.
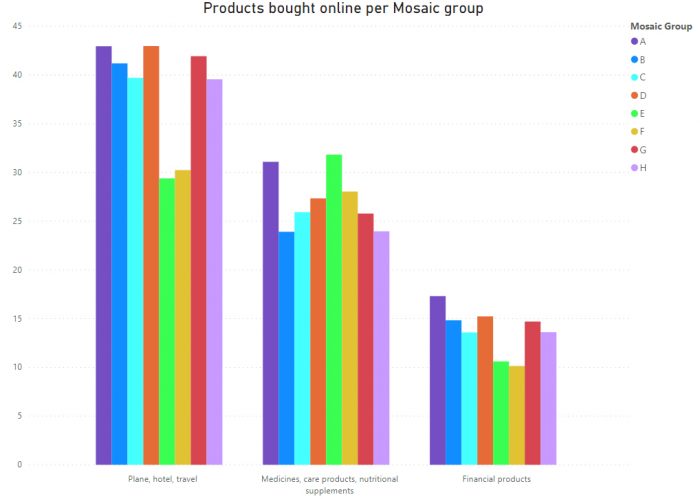
When we look at online buying behaviour across the Mosaic Belgium spectrum, we find some disparities. Mosaic Belgium is a fine segmentation of Belgian households. Households are divided into 8 groups and 33 types, thus bringing together households with similar behaviours and sociodemographic characteristics. This segmentation is extremely useful for marketing, and makes it possible not only to analyse customer behaviour but also to carry out geographical analyses.
The disparities we see relate mainly to the buying frequency and the motivations for buying online. We find that households in group A (privileged class) buy more books, interior decor items and cinema/museum tickets online than other households. Nearly 60% of these households buy at least once a month. Their main motivations are related to the absence of convenience difficulties and the unavailability of these products in physical stores.
Households with contrasting behaviour are found in group F (industrial tradition). Here there are slightly fewer households that regularly buy online (55%). Their buying behaviour is similar to what we see for the country as a whole. However, they have a more marked interest than other households in purchasing car parts, kitchen utensils and lottery products. These households are particularly sensitive to the lower price of items sold online.
Similarly, each Mosaic group and type has quite particular behaviours and motivations. By cross-referring your customer data with Mosaic Belgium data you will be able to adjust your offers and your marketing campaigns, and even create advanced purchasing prediction models.
One of the particular features of e-commerce is the huge range of items. This makes it complicated to offer relevant products in a price range adapted to the different visitors to the webshop. For an online shopper, there is nothing more frustrating than seeing only items based on their previous visits, or even items that have already been bought and are therefore irrelevant.
Cross-referencing between your product and customer data and Mosaic Belgium data allows you to go much further than simply extrapolating on the basis of the most recently viewed items.
Segmentation makes it possible to target more effectively, customise offers and even predict future purchases.
With Mosaic Belgium you will be able to create finely-tuned and sophisticated marketing campaigns. Segment your communication, target postcodes with strong representation of interested groups, retarget certain customer types, etc.
Contact us to discover the power of Mosaic Belgium or download the overview of groups and types.