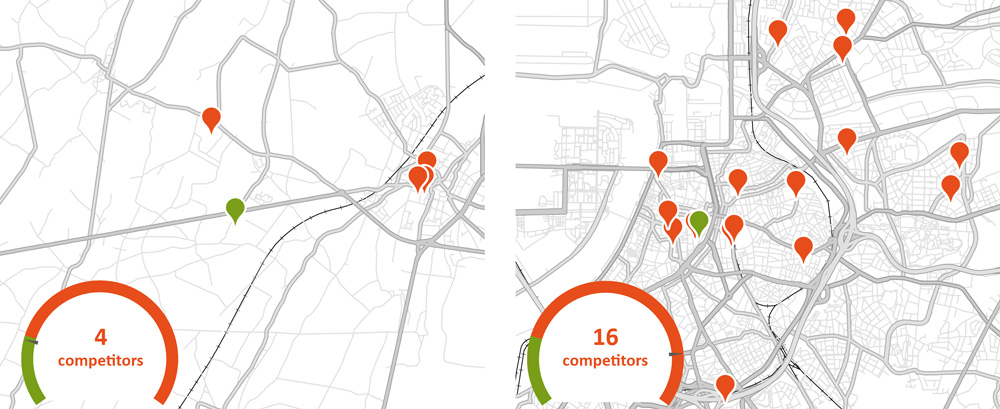
Each point of sale is not subject to the same competitive pressure. For example, some are surrounded by numerous competitors, while others have a local monopoly. The inclination of consumers towards the different brands also influences the pressure exerted by those brands.
The calculation of competitive pressure is carried out in different ways. Competition mapping makes it possible to understand whether or not the local market is relatively hostile. This approach is then refined in various ways: weighting according to proximity, modelling of the weight and attractiveness of each brand, modelling of the distribution of the target public’s budgets, etc.

The green symbols are the points of sale of the analysed network. The red symbols represent the points of sale of the competitors.
In these illustrations, we therefore see that a given brand is faced with a very different level of competition according to its location.