You want to open a new point of sale, but cannot decide between three possible locations. In this case, SIRIUS Insight can help you to quantify indicators that will allow you to make an informed decision.
In this geomarketing study, SIRIUS Insight analyses the potential catchment area of each location and verifies the following elements in particular:
This approach makes it possible to highlight in a simple manner the characteristics of the different locations chosen. This approach can be generalised by using an analytical model that includes these parameters for the whole of your point of sale network, allowing you to develop a long-term vision and development strategy.

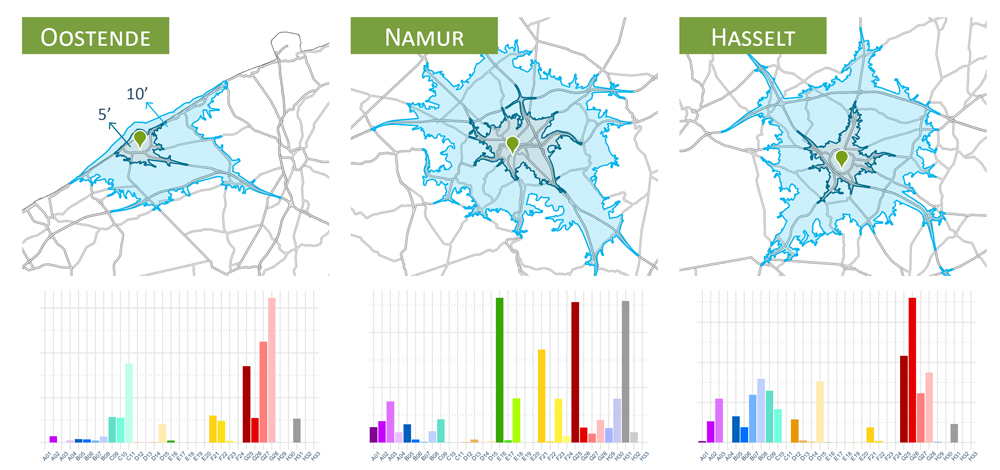
The first maps represent the catchment areas for a drivetime of 5 to 10 minutes around a preselected location. The histogram shows the volume of each Mosaic Belgium type within these areas.
Finally, the data are supplemented with information about the population, incomes and the accessible potential for the primary and secondary catchment areas of the three towns.
Thus, the illustrations allow us to see that the population is larger in Namur, but that the highest incomes are found in Hasselt. However, in the primary catchment area, the accessible market potential is almost identical for these two towns.