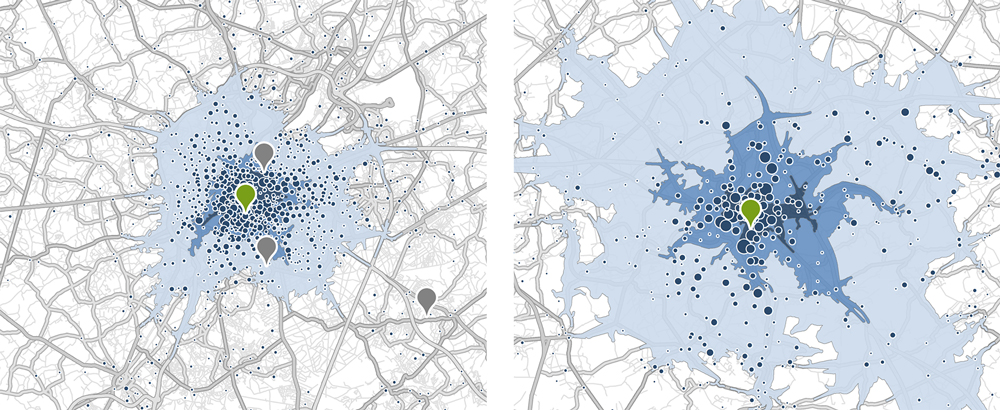
A catchment area is a geographical area that surrounds a point of sale and represents the origin of the majority of the customers. This space is also established on a forecast basis, particularly with a view to opening a new point of sale.
With this geomarketing analysis, you can find out the reach of your points of sale and the drivetime of your customers. We then compare this information for all your points of sale. Thus, we distinguish those that have a proximity role from those that cover a wider area.

The analysis of catchment areas also allows you to determine the “average” drivetime for your customers. The strictly quantitative analysis can be enlarged to include a qualitative component using our Mosaic Belgium database.
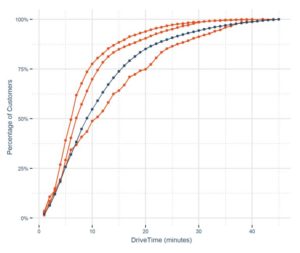
The catchment areas also give an indication of the concentration of customers around points of sale. For example, we observe on the graph that 80% of customers are located no more than 19 minutes from a point of sale.

On the map, the green symbol represents the studied point of sale. Around this point, three areas of accessibility are defined: drivetimes of 5 minutes, 10 minutes and 15 minutes. The grey symbols represent the points of sale in the network whose customers are not taken into account on the map. On the same maps you can also observe the customers’ origins by census district in the blue discs.
The orange curves in the second illustration show the percentage of customers located in relation to the drivetime from the point of sale. The longer the drivetime, the higher the percentage of customers covered. The blue curve represents the average of the entire point of sale network.