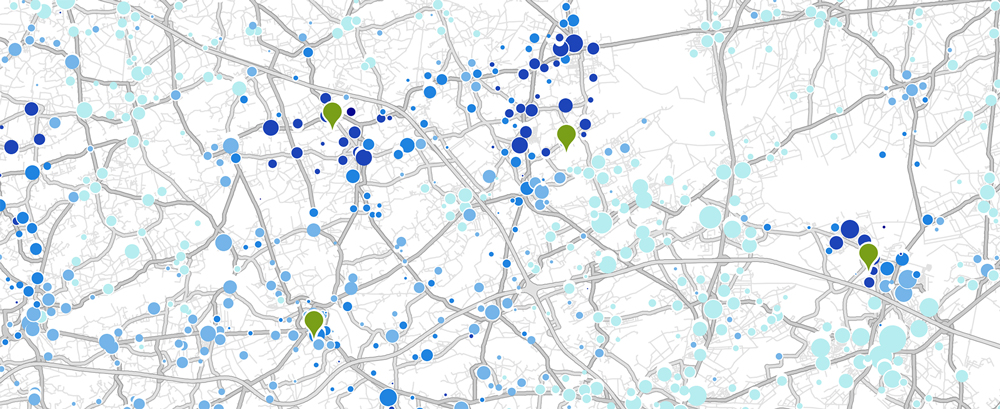
The penetration rate reflects the market coverage obtained by a product, a service or a point of sale. To this end, we see in this geomarketing study the proportion of the population that visits your points of sale, and you will be able to precisely visualise the area of influence of each of those points of sale.
The market penetration analysis will also allow you to understand the functioning of the network. In this way, you can verify for each point of sale whether it has a preponderantly local or regional role and determine the market coverage. Thus, you will be able to identify areas in your network where the market coverage is lower and expansion is possible.

The green symbols represent the points of sale, and the discs represent the customers living in the census districts. The size of the discs is proportional to the number of customers. Finally, the colour represents the proportion of customers related to the population present within the census district. In other words, the darker the colour, the greater the number of inhabitants in the census district who are customers.