“Dividuals Trends 2024: Beyond the Screen – 8 Trends in an On-Demand Economy” analyses the latest trends in consumer behaviour. These trends are influenced by digitalisation, economic pressure, changing communication, and mobility challenges. Discover how these factors shape the preferences and purchasing behaviour of Belgian consumers. The whitepaper uses extensive data from Dividuals, our consumer segmentation.
SIRIUS Insight, with 30 years of experience in geomarketing and consumer data, provides precise answers to strategic questions about your customers’ consumption habits and the development of yourretail network. We place your customers at the centre of our analyses and offer deep insights, based on the comprehensive data from Dividuals.
Discover the whitepaper on our Dividuals website
For over 30 years, SIRIUS Insight has been monitoring and analysing the behaviour of Belgian consumers. Mobility, purchasing habits, home equipment, financial management, and more than 2.000 topics are tracked and grouped by SIRIUS Insight within the Dividuals® consumer segmentation.
This whitepaper specifically addresses the eating habits of Belgian consumers and covers elements such as supermarkets, meal delivery, dining establishments, and much more. In addition to examining general trends in Belgian households, our analysis extends to regional variations, evolving patterns over the years, and the type of households showing the highest preferences through our Dividuals segmentation.
Discover the whitepaper on our Dividuals website
You may think you know your customers, thanks to your client data. But are these enough?
Client data is certainly a valuable source of information. It allows you to understand your customers’ consumption habits, the times they prefer to shop at your store, the average basket, the most popular items, the preferred range level, and so on. But without careful analysis, these results are useless. You therefore need to assemble your customers into different groups based on various criteria. This will give you several profiles that share similarities: the most regular customers, those who buy in larger volumes, those who prefer certain product categories, those from whom product categories are entirely absent, etc.

Don’t lose sight of the fact that this data is limited to the confines of your outlet. In other words, your customers have a life outside your store. For example, the customers you identify as the ones who do not consume wine may actually prefer buying from a wine merchant rather than from your supermarket. It would therefore make sense to appeal to these specific customers with the help of more exceptional products. This is just an example, but the basic idea is to demonstrate the need to take a step back from the data that you have.
To take the necessary step back and understand how consumers behave, SIRIUS Insight offers you Dividuals®, an advanced segmentation system that is representative of all Belgian households. With it, you can cross-reference the data collected from your customers in order to find out which categories of consumers they belong to, and finally lift the veil on information that was previously impossible for you to guess. Not only will you learn more about your customers, but you will also be able to recruit new ones and improve the way you approach them.
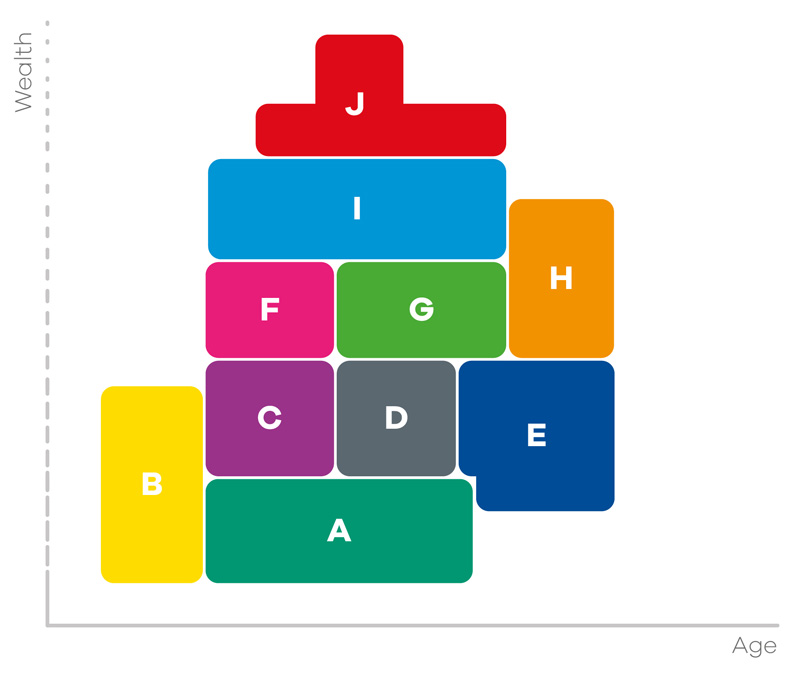
A Day by day
B Young and getting started
C Folksy and simple
D Kids leaving the nest
E Middle-class and senior
F On track and moving forward
G New projects to pursue
H Time to enjoy
I Prosperous and enterprising
J Wealth and prestige
Focus sur on your competitors
You’ve got all your ducks in a row and a shop that’s doing well. But you’re worried about a new competitor nearby. Admittedly, competitive pressure is always there, and it’s definitely something to keep in mind. Because no matter how you look at it, a competitor in the same location is going to want to attract some of your sales and customer potential.
But don’t panic just yet, because a direct competitor can also give you a turnover boost: after all, a competitor generates traffic. In other words, a competitor has many faces, and not every competitor is actually competitive. Another benefit is that competition keeps you on your toes. And remember, competitors are proof of the existing market potential.
Through various parameters and targeted analytical models, you get a good picture of your shop in its current configuration. How much turnover do you generate in normal circumstances?
How much customer potential is there in your area? Can you take advantage of the brand name or additional traffic builders in your area?
In summary, know what to expect from your shop and ask yourself as a retailer how you can deliver the added value that sets you apart from the competition. Retail is not an exact science, but that should not prevent you from regularly screening and updating your shops, both at the product and customer level, and even location. If you know the value of your shops, you also know the value of your competitors.
The world of competition has changed dramatically in recent years. That’s understandable, because the way in which retail reaches and serves its customer base is constantly changing. In this regard, think of the entire Internet, which is open to all kinds of providers. But let’s stay focused on the competition of physical locations. It definitely makes sense to see exactly what those competitors are doing and why their customers are choosing them.
So, first find out who your competitors are. Are they direct competitors who sell the exact same thing, or are they indirect competitors who are providing the market with an alternative? Or another option, is there internal competition in which fellow shop managers are competing with each other? In quite a few sectors, there is a high degree of cannibalisation between the various shops of the same retail chain.
Are they direct competitors who sell the exact same thing, or are they indirect competitors who are providing the market with an alternative?
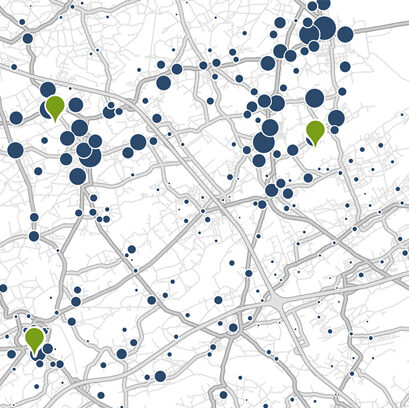
Competition is a tactical element that – depending on the sector – can be played out in many ways: a competitor for one is an ally for another. After all, you can also use your competitors strategically to improve the mutual competitive position – car dealers do it, and the same goes for kitchen shops and fashion shops. With the right neighbours, you’re safe, because you attract visitors with different profiles and complementary buying motives. Read more about Dividuals consumer segmentation.
In any case, it’s in your best interest to describe the competitive pressure as thoroughly as possible. A careful screening of competitors and target groups will help you start based on your own strengths. Based on the correct data and the necessary model calculations, the geomarketing experts at SIRIUS Insight can estimate the strength of the competitors, and, if desired, estimate a new projected turnover.
What gap are you filling in for your potential customers? This crucial question is more important today than ever. Because the time when people just went to the shop to buy a product is over. Retail must evolve along with the change. If you don’t, then you may be trampled underfoot for years to come. Especially in times when consumers are less loyal than before.
It’s simply a fact that in 2022 you can no longer wait five years to renew your shop, reconsider your range or review your target group. As a retailer, you’ll always have to be creative and respond quickly and intelligently to market trends and developments. But don’t be fooled: if you invest and innovate based on what you see in the competition, then your range will increasingly look like that of the competitor, and as a result you will lose your distinguishing factor.
The number of points of sale in Belgium may have decreased in the past decade, but the shop floor area has increased more strongly, together with a wider range. This can also cause a problem with your competitor: if they have a larger shop with a much larger range, they will be able to convince customers more easily on their shop floor. If you’re considering expanding or renovating your shop, or you want to know what impact the changes have on a competitor, SIRIUS Insight can guide you with an up-to-date and accurate turnover calculation, so that you can make the right strategic decision.
Put all the strengths and weaknesses in a matrix so that you can easily determine the competitiveness of your shops: what is their distinctive ability and what opportunities in the market can they respond to.
Belgium has a wide range of shopping possibilities, ranging from shops in the city centre and strip malls to shopping malls, retail parks and solitary locations. Where and how is your competitor located? What is their target group? In what way are they trying to differentiate themselves? And what consequences does this have for you? It’s simple, as long as you look at your own figures and see that your shop is still doing fine, there’s no need to panic and make hasty decisions. However, if you’re seeing a downward trend, then you know there is a problem with your shop. That problem may have already been there; the competition has only made it worse.
And remember: a new competitor doesn’t always have an impact, and more importantly, a competitor can also be good news. For example, business clusters have a strengthening effect, or you can take advantage of a competitor that generates extra traffic due to their reputation. It may also be the case that your competitor is too far away from you: in urban areas, a competitor 1 km away may be too far away or appeal to a different type of target group.
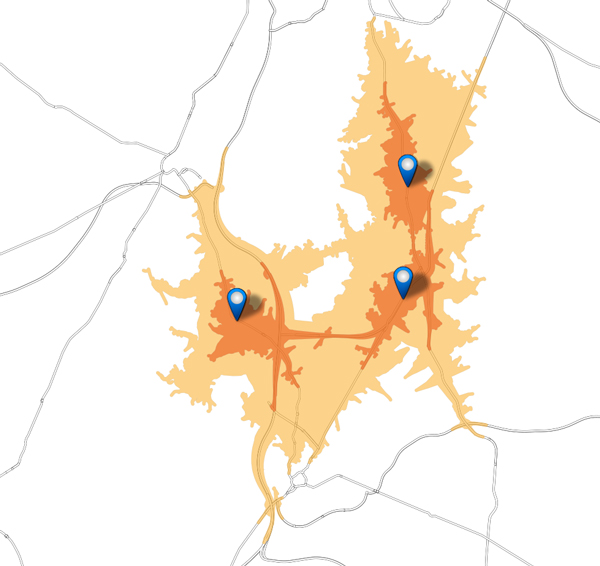
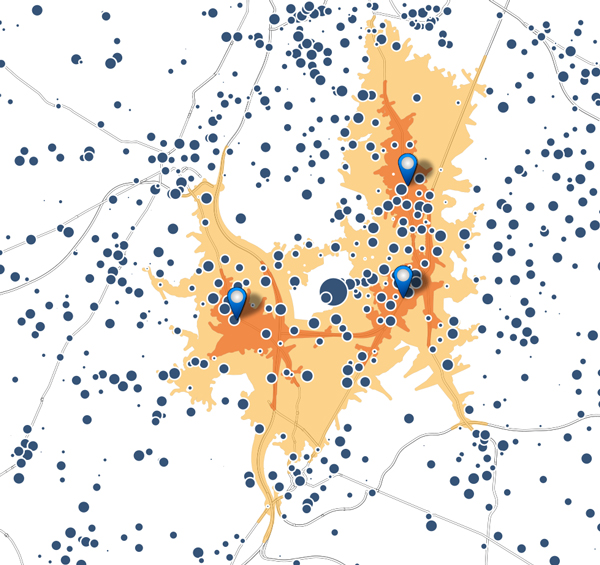
It’s definitely a good idea to visualise your competitors – including their sales area – on a map. This way you not only keep your finger on the pulse, but you know where you stand and what you have to take into account. Investments may be needed to strengthen your market position. SIRIUS Insight can put you on the right track with an objective turnover and risk assessment.
SIRIUS Insight supports retail and marketing managers in the most efficient way in making their strategic geomarketing decisions. We offer innovative insights – with a unique look at customers and channels – to create benefits for our customers in optimising their marketing and sales. You can count on our support for:

From traditional shopper to online shopper
What is certain is that purchasing behaviour has changed drastically, and the role of retail along with it. So you can ask yourself to what extent your location strategy is still the right one. All the more because it looks like a smart omnichannel location strategy is the new ‘way to go’.
Today consumers expect to be able to order any time and anywhere, that they immediately know whether their product is available online or offline, and that their order can be delivered in the way that suits them best. In short, the modern consumer wants to choose where and when they shop and, what’s more, they are continuously connected with their smartphone and tablet. For your customers, there is no wall between online and offline. That kind of pigeonholing is a thing of the past, because in the new world the synergy between online and offline retail is the key to success. Retailers who follow their customers and are not afraid to invest and innovate have the wind in their backs. In other words, it’s not about or/or. It’s and/and.
Retailers have long viewed the digital world as another planet, as a competitor of the brick and mortar shops. But both are complementary and there is a fruitful interaction between the two. So what exactly is the role of online and your own shops? They each activate and strengthen the customer relationship at a different time and in a different way. The webshop opens the door to your brick and mortar shop, so to speak, and vice versa. It’s essential for omnichannel companies to understand that online and offline can no longer be viewed separately.
Recent scenarios such as ROPO (Research Online, Purchase Offline) and BOPUS (Buy Online Pick Up in Store) are not only gaining popularity but are important service pillars of an all-out omnichannel strategy. Therefore, a combination of online and offline offers many advantages: more customers, always open and organisationally a great deal has already been provided, so that nothing stands in the way of orienting the brick and mortar shops as a warehouse location and fulfilment centre. In addition, linking online and offline creates extra means of communication to reach customers effectively. This way you increase your chances of a sale compared to a ‘shop only’ approach.
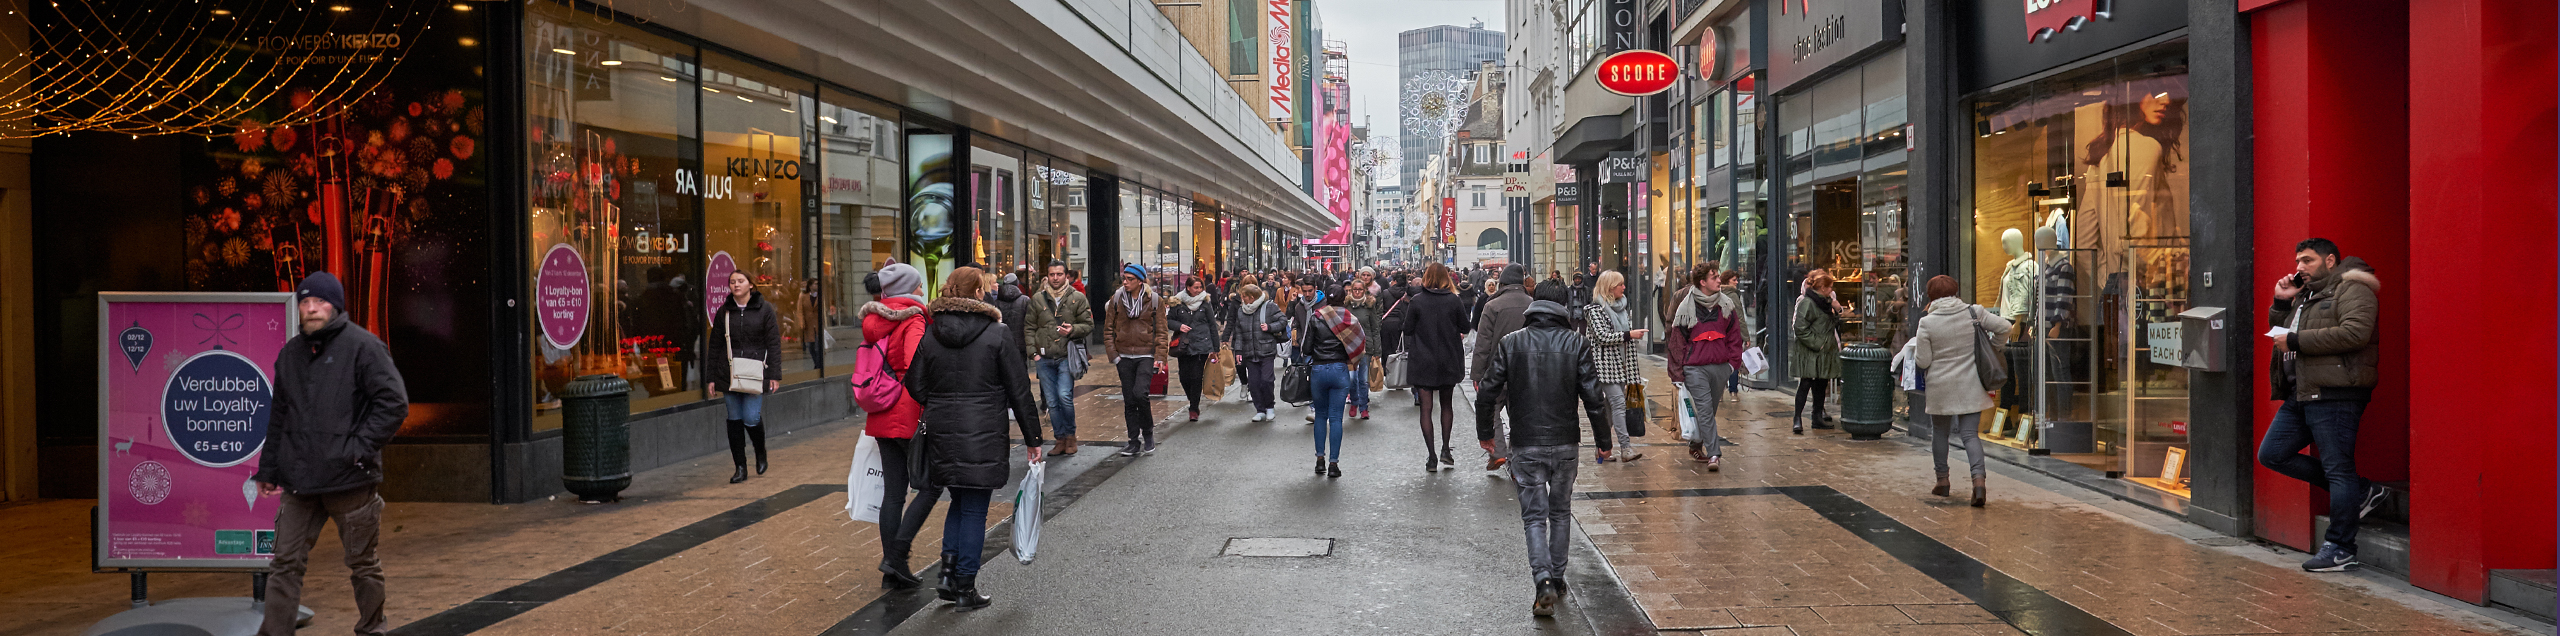
The threshold to buy online has become much lower since corona. Customers who previously never bought online before have now made their first clicks in the webshops. A large number of them will continue to do so, but an explosive growth is not immediately expected. What can be expected is that a significant part of the further e-commerce growth will come from generations Y and Z. Therefore, it’s worthwhile for omnichannel companies to keep the right consumer profile in mind: where do they live, what is their sociodemographic profile, which type of customers opt for in-shop pick up and which for doorstep delivery? Strong determining factors for the digital customer versus non-digital customer ratio are age, wealth and urbanisation.
Also keep in mind that both traditional and young consumers continue to flock to brick and mortar shops for the real shopping experience. The large cities in particular, with their attractive combination of shops, cafés and restaurants, are the social meeting place par excellence.
It’s still the brick and mortar shops that make the difference online: retailers realise significantly more online sales in areas close to their physical locations.
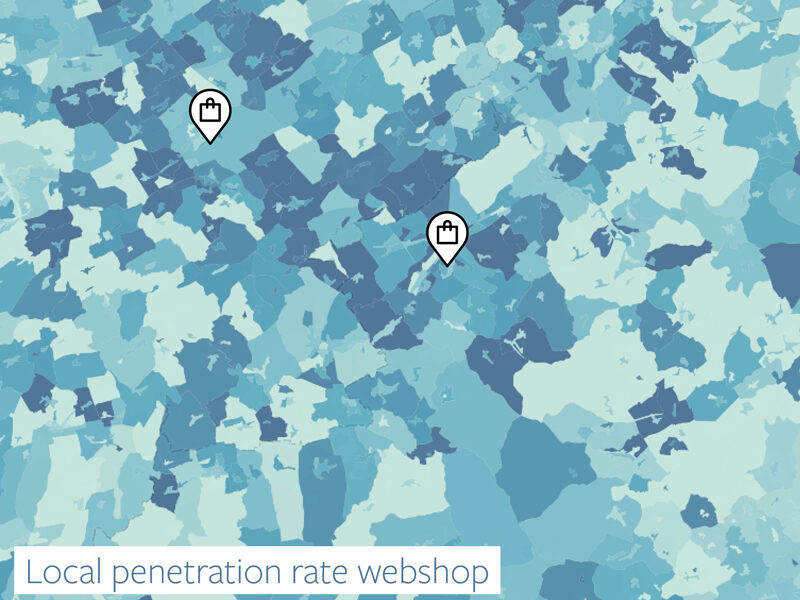
Retailers realise significantly more online sales in areas close to their physical locations. In those regions there is greater brand awareness, more consumer confidence and the customer is in the immediate vicinity to pick up their package. Therefore, the combination of online and brick and mortar is particularly advantageous.
The closer a customer lives to a brick and mortar shop, the greater the chance that they will buy from your webshop. This effect is a distinct advantage over the pure web players. Another advantage is that you can map this effect around certain shop and then take the right action to stimulate the online/offline interaction. Or better said, to combine the power of the webshop with the advantages of the shop.
Range: the multichannel experience gives the consumer a perfect overview of the online and offline stock, and the retailer can significantly expand the range.
Convenience: if customers need a product that can’t be found in the shop, they can order it online and have it delivered or picked up in the brick and mortar shop.
Shop experience: the retailer can focus on a customer-friendly shopping experience that is geared towards the product benefits and doesn’t have to worry about a stock that is too large for the available retail space.
Both in the offline and online world, correctly estimating your customers and their expectations remains top priority. Who are your customers and why do they want to order products or services from you online? Is the webshop exclusively aimed at sales or is the site also designed to support existing customers? And not unimportant, how do your digital customers differ from the non-digital customers? It’s therefore not surprising that in 2022 retail and technology are inextricably linked. In this case, think of data-driven tools and AI to serve customers even more personally, to predict demand more precisely or to optimally manage the growing online customer base. One thing is already clear: only with a robust data-driven approach are you as a retailer prepared to respond quickly to changing consumer behaviour.
No one will deny that the online migration is a positive effect of corona. And every retailer now also knows that post-corona is not business as usual. In the current competitive omnichannel environment, ‘bricks & clicks’ put you firmly in the saddle to develop a stable and future-proof omnichannel retail network.
In that sense, you should embrace online, simply because it offers opportunities and because it allows you to reach an infinitely greater number of people. Your webshop can also be a powerful marketing weapon to get your potential customers to the shop floor. And don’t forget the old adage: ‘If you don’t do it, your competitor will.’ Because that too is a lesson to remember, if your customers find an easier way to purchase a similar product from a competitor, it will be even more difficult to win those customers back again.
Offline can still be the core business, but the combination with online generally leads to growth. However, a condition is that you as an organisation have well-integrated commercial and logistics business processes and IT systems.
SIRIUS Insight supports retail and marketing managers in the most efficient way in making their strategic geomarketing decisions. We offer innovative insights – with a unique look at customers and channels – to create benefits for our customers in optimising their online and offline retail. You can count on our support for strategic questions such as:
Contact us to discuss your project.
Disappointing sales numbers… how do you tackle them?
Do you manage a fantastic shop that just doesn’t make enough sales? Or a sales point from your franchise that stays well below target numbers? Or do you have a shop that still doesn’t generate the expected turnover several years in a row? In short, dark clouds are gathering above your shop and you need to change course, now!
Turning the tide is possible! Our geomarketing experts will analyse precisely where the problem lies, so that you can focus on making specific improvements. Including many new insights about location, mobility, market- and turnover potential and the consumption behaviour of your target group.
In other words, all the necessary tools to benchmark your shops in a specific way and to get the maximum return from your retail network.
The first hurdle is figuring out the cause of the low performance. Is it the environment? For example, due to a bad choice of location or total lack of visibility, both offline and online. Or is it the way the shop is managed? Sticking with outdated marketing- and sales techniques for too long. Or are you not taking the increasing competition and market changes into account? Or is there just no possibility for improvement? All crucial questions for every omnichannel retailer.
Questions that also make clear that a data-driven approach is more important than ever. This allows you to find out how much turnover a specific sales point can achieve through the use of smart geomarketing algorithms. Very handy to find out if the full potential is being utilised.
Now more than ever it’s important to give your shops an identity and to distinguish yourself from your competitors. And, just as important, as a retailer you have to continually innovate and challenge in order to stay attractive to the consumer. Therefore, it’s important to start from a clear vision: what do I want to achieve with my shop, what price- and service levels do I offer, what range do I use to reach which customer and how much pressure is there from the competition?
If you select the right market for what you have to offer – a market with lots of potential customers who need your products – you’ve already got a head start. You start by mapping out the market potential, which is a rough estimate of the number of customers that could potentially buy your products, as accurately as possible. When doing this, also take into account the sociodemographic profile of your customers and the local population as well as the perfect neighbours because they are strong traffic builders.
The million dollar question: who is your competition and do they actually have the same target group? The answers to these questions will help you choose the best strategy for dealing with your competitors. Don’t forget your internal competition, or in other words: to what degree does a certain shop cannibalise on nearby shops from the retail network? And not to forget the impact of your own webshop, which in these pandemic times can also contribute significantly to your total revenue.
How much turnover can I generate in that location? Don’t estimate this based on guesswork; make calculations for your potential market based on accurate information and study the various factors: target group, demographic data, shopping patterns, spending on consumption, competitors and things like passers-by. Based on this, you can calculate your first turnover prognosis. SIRIUS Insight’s expertise will of course help you reach an even more reliable turnover estimate.
You can assess shop performance based on the shop KPIs, and by clustering similar shops from your network you can compare which shops perform well or not, taking into account the surroundings and possible sector-specific predictions: is the market still growing or is it shrinking?
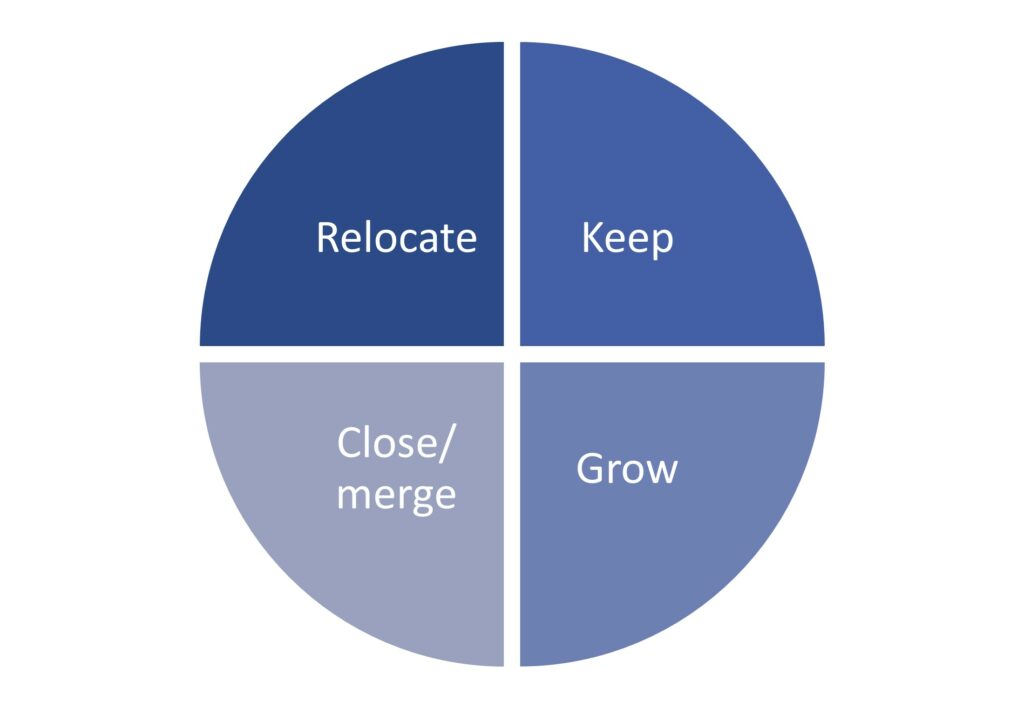
That’s why it’s so important to draw up a well-thought-out plan, to set a turnover goal and to determine the correct location with sufficient customer potential. Those who are fast to react can also develop suitable plans of action to improve an insufficient penetration rate or visit frequency. Or, as a worst case scenario: which underperforming shops should you move or eliminate, and which ones can still be salvaged?
It’s important to check which types of customers you’re attracting. How many people and families of this type live in my region? How much do these people spend annually? How much revenue is generated by customers who live nearby and how much by customers who live farther away? To define and localise your target group, SIRIUS Insight uses the Mosaic Belgium consumer segmentation. Defining and localising your target group makes it possible for you to develop the right range for those consumers who are most interested in your products. The end result is that you will recognise relevant patterns, connections and trends that allow the marketing- and sales teams to fully understand the customers.

The question is not whether you have to focus your marketing more on your region but whether your marketing efforts are reaching the right target group with the right content. Determine in which zones it’s better to organise flyer handouts and for which customers direct mailing campaigns work best. By better understanding your target group, you will be able to determine which arguments have the most impact.
In the case of disappointing shop turnover, you must first determine how well the shop should perform and how the local synergy works to your disadvantage. Make sure to get to know your ideal customer well, including their specific demographic traits, critically assess the market size for your products, analyse where your shop is situated within that market and map out the competition.
Then use the data you’ve acquired to your advantage, support your conclusions with solid research and be aware that as a retailer you must dare to re-evaluate your strategy if things are stagnating. Anyone who is working in the wrong market, or in the right market but at the wrong time, will have to go full steam ahead to keep their head above water.
One thing is certain: as a retailer you must be able to react quickly to changing environmental factors and a changing market. Are some regions underperforming? Do we have to increase our marketing efforts there? Has the competition increased or the potential decreased? Or is it better to move or even close the shop? One word of advice: reduce the risk of wrong choices to the absolute minimum with the expertise from SIRIUS Insight.
SIRIUS Insight supports retail managers in the most efficient way when making strategic geomarketing decisions. We offer reliable answers to strategic questions about your retail network, the location of sales points and the consumption habits of your customers. You can count on our support for:

Changes in household income
SIRIUS Insight is an expert in geomarketing and has been active for over 30 years on the Belgian market. We closely monitor the characteristics of Belgian households and how these change over time. Thanks to this detailed knowledge, we have the most advanced data on the Belgian market. The Belgian population is constantly changing, and this affects every merchant and non-merchant company operating in a B2C or B2B2C environment.
Through a series of articles on Belgian demographics, you will discover the changes over the last ten years and how these changes affect you. In this fourth article, we examine the changes in household income.
For this fourth analysis, we looked at the changes in the income of Belgian inhabitants between 2011 and 2019 (the most recent year for which official data is available). This refers to the gross income for the full year for all inhabitants, regardless of their age. This approach helps to eliminate the effect of joint reporting by married couples or statutory cohabitants.
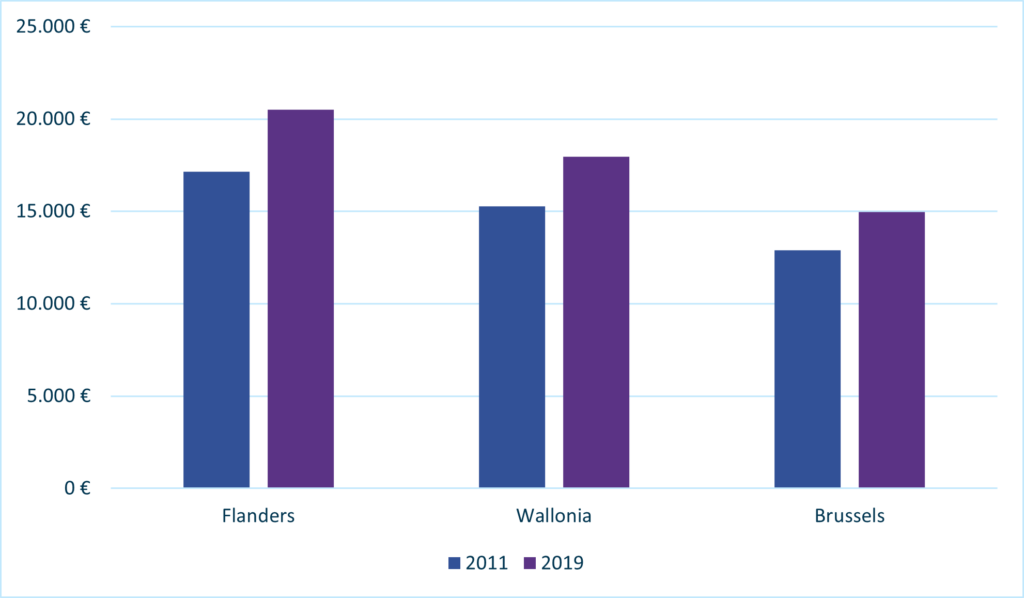
Household incomes in Belgium underwent a substantial change over the reference period. Average income increased by €3.000 from €16.100 in 2011 to €19.100 in 2019. In Flanders, the average income was the highest (€20.500 per capita) and saw the most marked increase (+€3.400 per capita). In Wallonia, the average income increased by €2.700 to reach €18.000 in 2019. The inhabitants of Brussels have the lowest average income (€15.000 per capita) and the lowest growth (+€2.000 per capita).
The figures presented in the preceding paragraph highlight regional disparities. When we look at inhabitants’ incomes at province level, we can nuance some of the findings. The provinces with the highest incomes (approx. €22.000 per capita) are Flemish Brabant and Walloon Brabant. The other Flemish provinces have more similar incomes (€20.000). In Wallonia, the situation is more mixed. The average income varies between €16.500 and €22.000 per capita. The highest growth is in West Flanders (+€3.500 per capita), while the lowest is in Brussels (+€2.000 per capita).
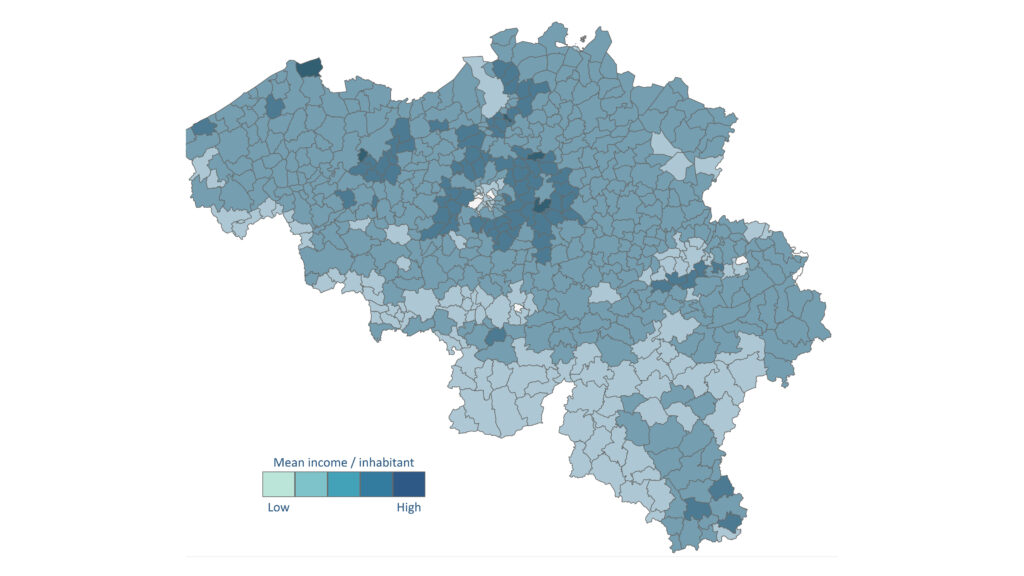
If we go down to municipality level, we can see that the most affluent municipalities are found mainly in the outskirts of Brussels. The other most affluent municipalities are located mainly in the outskirts of other major cities: Antwerp, Ghent, Leuven, Liège and Charleroi. The Belgian coast and several municipalities close to the Luxembourg border also have households with higher incomes. The lowest incomes are mainly found in the Sambre-Meuse valley, and also more markedly in the south of the country.
Purchasing power in Belgium varies greatly. Even the way in which this purchasing power changes shows substantial disparities. Disposable income, population age and socio-economic status affect consumption habits. These differences and their evolution change the needs of households. These needs concern, for example, the purchase of basic necessities, mobility, clothing, and different types of shops and services. For merchant and non-merchant actors like yourselves, it is essential to understand the local variations so that you can offer the appropriate services to the right target groups in the right locations. Acquiring data such as that offered by SIRIUS Insight will enable you to cope with all of these nuances and adjust your development according to local needs.
With 30 years’ experience, SIRIUS Insight can help you to define and locate your target group. We help businesses in all sectors to develop an efficient network of points of contact that meets the needs of your target group. We have the most up-to-date and advanced data on Belgian consumers, while respecting their privacy. Contact us if you would like to obtain quality support or have access to our different types of detailed data.
Look out for more articles on the changing Belgian population and its diversity.
In the coming weeks, we will also examine the changes in household income and in housing. Don’t want to miss anything? Sign up immediately for our newsletter.

The size of households in Belgium
SIRIUS Insight is an expert in geomarketing and has been active for over 30 years on the Belgian market. We closely monitor the characteristics of Belgian households and how these change over time. Thanks to this detailed knowledge, we have the most advanced data on the Belgian market. The Belgian population is constantly changing, and this affects every merchant and non-merchant company operating in a B2C or B2B2C environment.
Through a series of articles on Belgian demographics, you will discover the changes over the last ten years and how these changes affect you. In this third article, we examine the changes in the size and types of households.
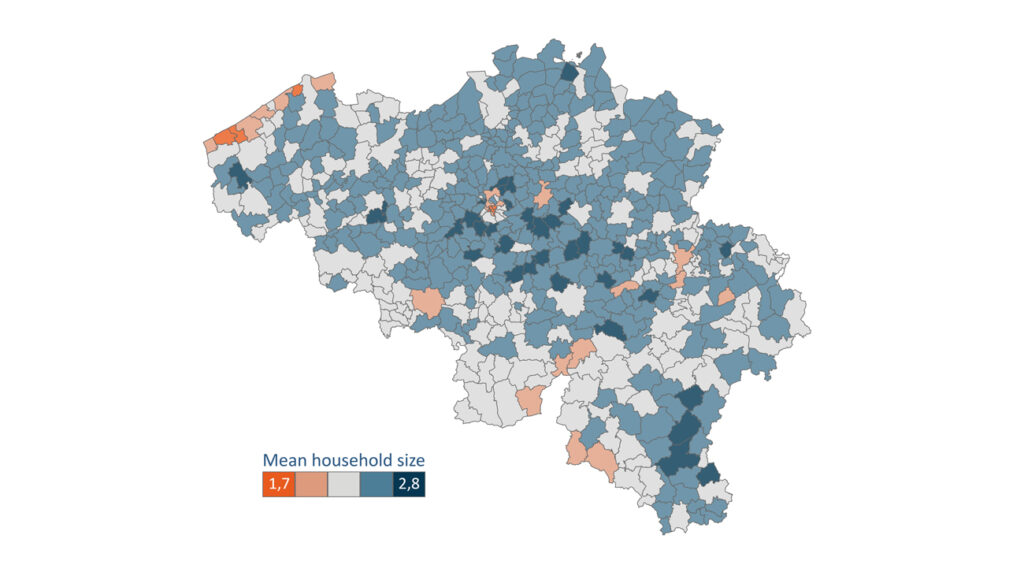
In 2021, Belgium had 11,5 million inhabitants divided into 5 million households. The average household size in Belgium is 2,3 people per household. When we look at how this average family size has evolved over the last decade, we see that the size has remained fairly stable. However, a slight trend can be discerned. In Flanders and Wallonia, the size of households is decreasing slightly, whereas in Brussels we see a slight increase.
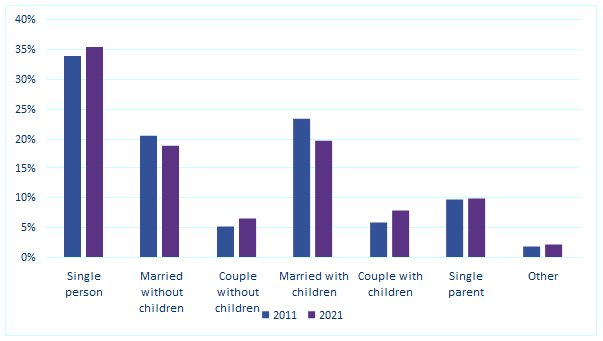
Families with or without children, married couples, single people, etc. – what type of household do we find the most in Belgium? What trends can be seen? Firstly, it is interesting to know that 65% of households are composed of at least two people, and therefore 35% of households are composed of only one person. This proportion of “single-person” households has risen over the last decade. It should be noted that the category labelled “single-person” includes all persons living alone, whether they are actually unmarried, separated or widowed.
Marital status has also evolved over the past 10 years. There are significantly more unmarried couples (with or without children) today than in 2011.
In previous articles (population volume, population age), we saw that some changes show local variations. For example, the Brussels population is growing faster, but its age remains stable over time. There are also some notable differences in terms of the different types of households represented.
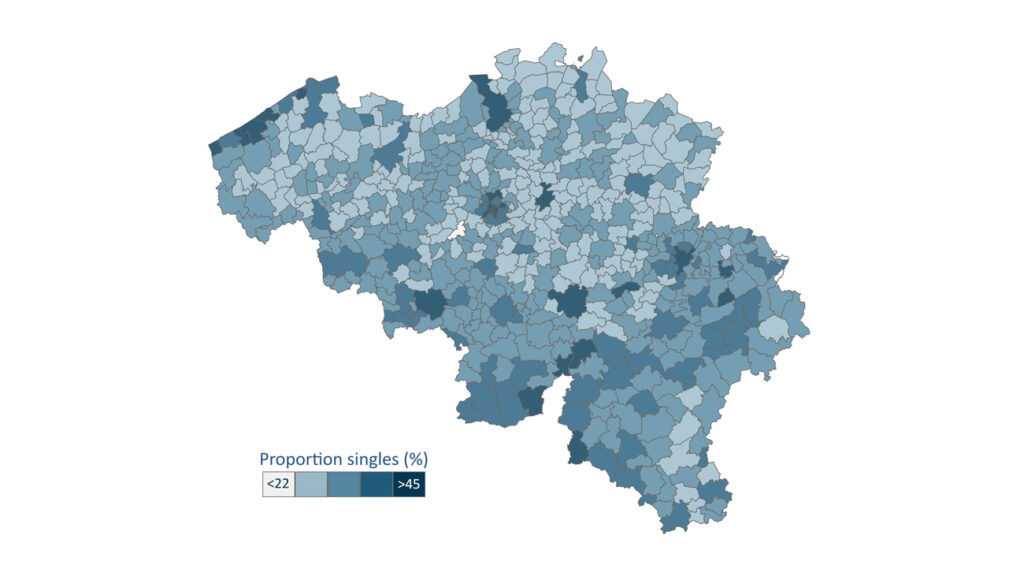
Almost one in two households is composed of only one person in Brussels.
This type of household represents 46% of all Brussels households. In Wallonia, it represents 37% of households, while the figure for Flanders is 32%. In contrast, over the last ten years, this proportion has remained stable in Brussels, while it is growing in other parts of the country.
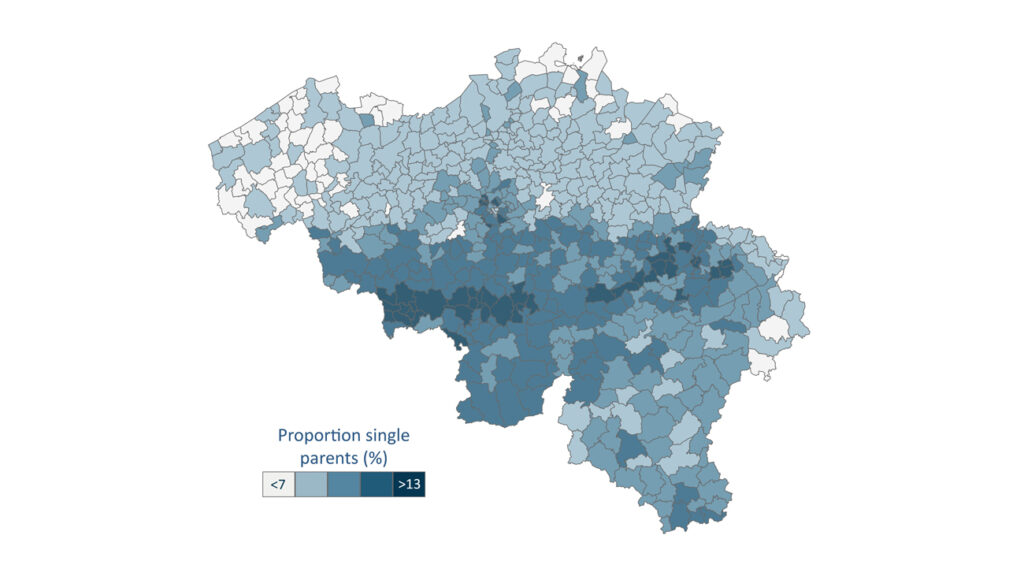
In Wallonia and Brussels (12%), the proportion of single-parent families is significantly higher than in Flanders (8%). Far more married couples with no children are found in Flanders (22%) than in Brussels (9%) and Wallonia (16%). In West Flanders, the situation is even more marked. One in four households is a married couple without children.
These changes in household types, including the growth of “single-person” households, bring about changes in needs. These households do not have the same means or the same needs, and they have different consumption habits. These needs concern housing, mobility, product packaging, types of shops and services of different kinds. For merchant and non-merchant actors like yourselves, it is essential to understand the local variations so that you can offer the appropriate services to the right target groups in the right locations.
With 30 years’ experience, SIRIUS Insight can help you to define and locate your target group. We help businesses in all sectors to develop an efficient network of points of contact that meets the needs of your target group. We have the most up-to-date and advanced data on Belgian consumers, while respecting their privacy. Contact us if you would like to obtain quality support or have access to our different types of detailed data.
Look out for more articles on the changing Belgian population and its diversity.
In the coming weeks, we will also examine the changes in household income and in housing. Don’t want to miss anything? Sign up immediately for our newsletter.

An ageing population in Belgium?
SIRIUS Insight is an expert in geomarketing and has been active for over 30 years on the Belgian market. We closely monitor the characteristics of Belgian households and how these change over time. Thanks to this detailed knowledge, we have the most advanced data on the Belgian market. The Belgian population is constantly changing, and this affects every merchant and non-merchant company operating in a B2C or B2B2C environment.
Through a series of articles on Belgian demographics, you will discover the changes in the population structure over the last ten years and how these changes affect you. The subject of this second article: is the Belgian population getting older?
To answer this question, we looked closely at the age of the Belgian population in 2011 and in 2021. We used the age of each inhabitant and analysed averages, evolutions, etc. The conclusion is that the average age of the Belgian population has increased over the last ten years. Today, the average age of the Belgian population is 41 years and 6 months, whereas in 2011 it was 40 years and 5 months. Taking the entire Belgian population into account, the average age has therefore increased by 11 months.
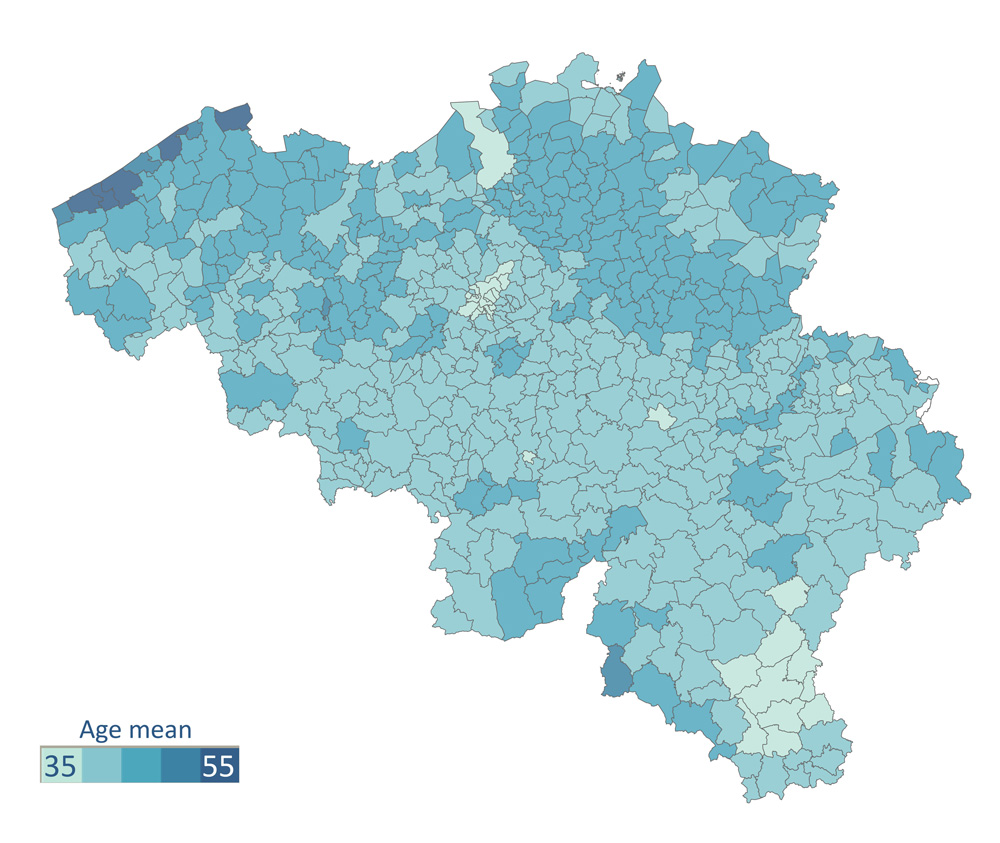
If we examine the age data by region, we can see two important differences. Firstly, the population of Brussels is significantly younger. In Brussels, the average age is 37 years and 2 months, while it stands at 41 years and 2 months in Wallonia and 42 years and 5 months in Flanders. Secondly, the average age of the Brussels population has hardly changed over the last ten years, whereas it has increased by one year and 2 months in Flanders and Wallonia.
Between the municipality with the lowest average age and the one with the highest average age, there is a difference of almost 20 years. In Coxyde, the average age is 54 years and 7 months, while in Molenbeek it stands at 34 years and 8 months. As the map shows, the municipalities with the highest average age lie on the Belgian coast. In general, we can see that the Flanders population is older than the population of Wallonia and Brussels. The “youngest” municipalities are found in Brussels, Antwerp and around Neufchâteau.
The ageing of the population, and therefore the profile of consumers, brings about changes in the needs of the population. Age is an important factor in the consumption of most products and services, in merchant and non-merchant environments alike. Whether you operate in healthcare, retail, banking or any other sector, it is essential to take this notion and local variations into account in order to adjust your offer and your development strategy.
With 30 years’ experience, SIRIUS Insight can help you to define and locate your target group. We help businesses in all sectors to develop an efficient network of points of contact that meets the needs of your target group. We have the most up-to-date and advanced data on Belgian consumers, while respecting their privacy. Contact us if you would like to obtain quality support or have access to our different types of detailed data.
Look out for more articles on the changing Belgian population and its diversity.
In the coming weeks, we will also examine the changes in types of households and in income. You do not want to miss anything? Sign up immediately for our newsletter.

Are there more and more people in Belgium?
For over 30 years, SIRIUS Insight has been closely monitoring the changing characteristics of the Belgian households. Our company, an expert in geomarketing, therefore has the most advanced and detailed data on the Belgian market. Population changes affect every merchant and non-merchant company that has direct contact with the end consumer.
Through a series of articles on Belgian demographics, you will discover the changes in the population structure over the last ten years and how these changes affect you. The first essential question: is the Belgian population growing?
Yes, the Belgian population is increasing every year. In 2021, there were almost 600.000 more inhabitants than in 2011. The total population is now 11,5 million. Over a single decade, the population of Belgium has grown by 5%. The regional distribution of the Belgian population is as follows: 57% in Flanders, 32% in Wallonia and 11% in Brussels.
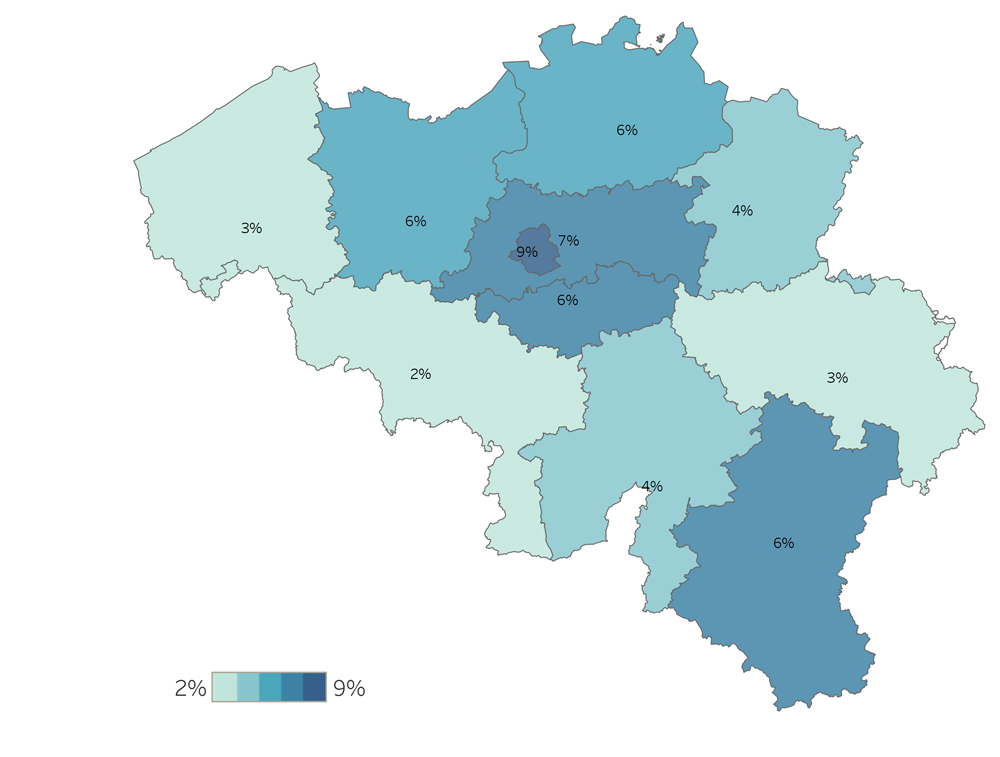
If we look closely at the demographic data for the last ten years, we can see that the population increase is happening throughout the entire country, but not at the same pace. Brussels is where the number of inhabitants is increasing the fastest. Between 2011 and 2021, its population increased by 9%, while Flanders and Wallonia saw increases of 5% and 3% respectively.
At a more granular level, we can see important differences between the growth rates of each of the provinces. After Brussels, the most marked increases in the number of inhabitants occurred in Flemish Brabant, Luxembourg and Antwerp. The population of Flemish Brabant grew by 7%, while the other two provinces saw increases of 6%. Conversely, the province of Hainaut now has only 2% more inhabitants than in 2011.
Growth in the number of inhabitants, and therefore in the number of consumers, causes changes in the needs of the population. These needs relate to schools, healthcare, trades and services of different kinds. For merchant and non-merchant actors like yourselves, it is essential to understand the local variations, as well as the impact on the services you offer.
With 30 years’ experience, SIRIUS Insight can help you to define and locate your target group. We help businesses in all sectors to develop an efficient network of points of contact that meets the needs of your target group. We have the most up-to-date and advanced data on Belgian consumers, while respecting their privacy. Contact us if you would like to obtain quality support or have access to our different types of detailed data.
Look out for more articles soon on the changing Belgian population. We will be examining changes in the age of the population, types of household and income. Don’t want to miss anything? Sign up immediately for our newsletter.